
Case studies
What changed after the analysis?
The full stories: awkward starting points, methods that survived contact with reality, and the numbers that moved afterwards.
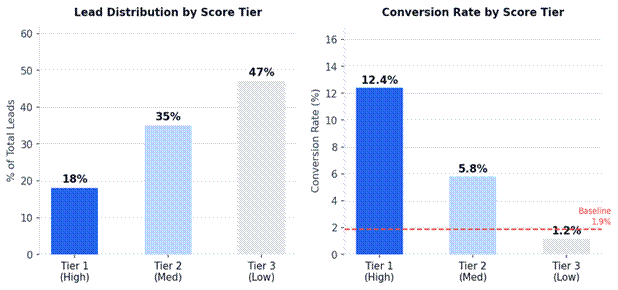
Transforming Customer Targeting, 3x Conversion Rate Improvement
How True Corporation moved from gut-feel segmentation to ML-driven targeting — and tripled conversion rates in weeks.
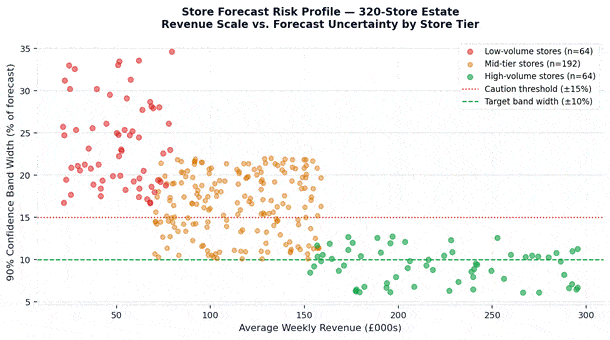
320 Stores. One Number Each. Finally One They Could Trust.
How a European Specialty Retailer Replaced Estate-Wide Spreadsheet Guesswork with Store-Level Revenue Forecasts, Confidence Bands, and a Planning Cadence That Actually Held.
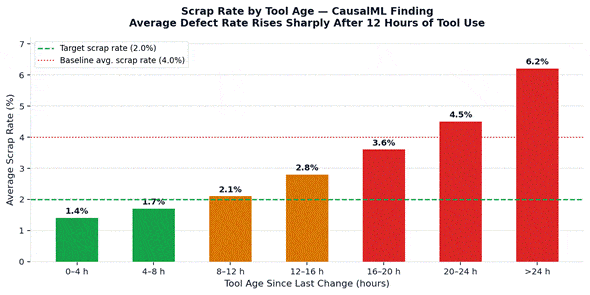
4% Scrap. The Dashboards Said Everything. They Explained Nothing.
How a European Manufacturer Stopped Guessing at Root Causes and Used Graphite Note Desicion Lever framework to Cut Scrap by 1.9 Percentage Points in Six Months.
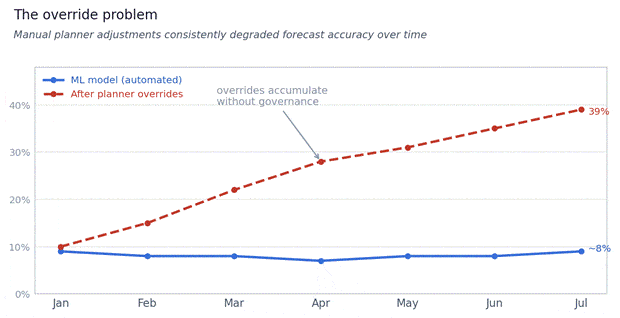
From 39% Forecast Error to Decision-Ready Demand Intelligence
How a mid-market automotive parts distributor replaced ERP-default forecasting with a 50,000-SKU decision intelligence system
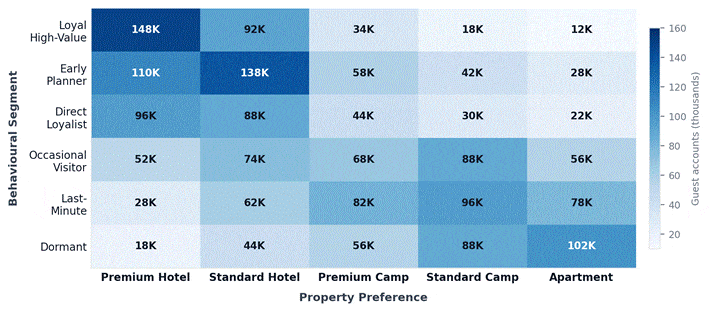
Guest Intelligence at Scale: Four-Dimension Audience Segmentation for a Major Resort Group
How Decision Intelligence gave a multi-property resort operator its first complete view of 3.8 million guests — without touching the CRM query interface.
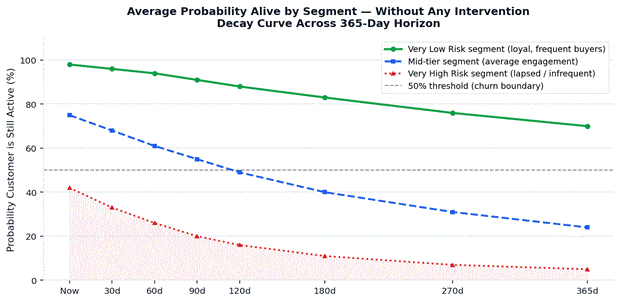
From Gut Feel to CLV Score: How One Retailer Stopped Guessing Which Customers Were Worth Keeping
How a US Omnichannel Home Goods Retailer Used CLV Modelling to Identify At-Risk Customers Before They Churned, Score Every Buyer by Future Value, and Shift $4.1M in Marketing Spend to Where It Would Actually Return.
What decision is holding your team back?
Bring us the business question and the data you already have.