Leads Scoring Model for your Business
Your leads scoring model plays an important role in your business. Your lead scoring model helps you to prioritize and nurture potential customers. This turns your marketing and sales efforts from a guessing game to a data-driven approach. Let’s assess how to create a lead scoring model using predictive analytics.
What is a lead?
A lead represents a potential customer. A potential customer is interested in buying your products or services. To grow your business, it’s important to change the process of identifying leads. Move away from using a long list of people or companies that have some interest in the product or service you offer. Using lead scoring models makes it more efficient. We show you how a lead scoring model benefits your business.
What is lead generation?
Lead generation is a critical part of your business function. Different lead scoring models can have different results for your business. Generating leads is not enough. You need a lead scoring system to help you optimize for the best results. Predictive lead scoring with no-code analytics can help. Using no-code analytics refines your lead scoring process. Predictive analytics give you enhanced lead scoring systems. Predictive analytics can also help you refine your lead scoring matrix.
What is a leads scoring model?
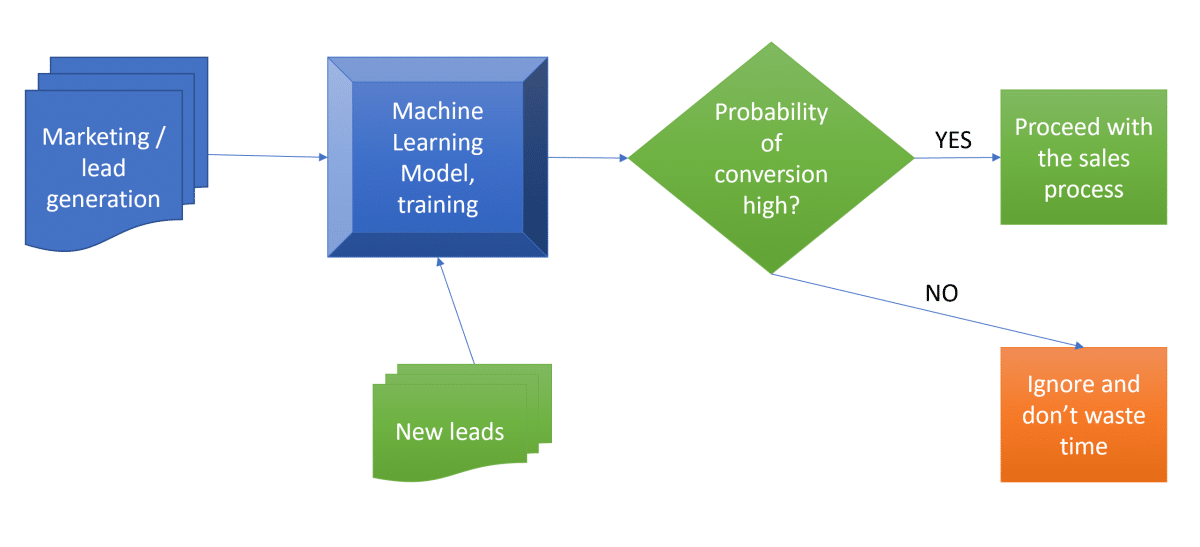
A lead scoring model is a methodology where we train machine learning models to learn from historical data. In our example, the model will learn to classify leads in two states – “will convert” and “will not convert.” It will also understand what influences the leads to convert. This lead scoring formula helps you decide which leads will most likely turn into a customer. Using a lead scoring model, you can define a lead scoring threshold, and enable your team to focus on relevant leads.
Lead scoring criteria
If your team has many leads but not enough resources to pursue them all, you must prioritize your sales teams’ time. Using good lead scoring criteria helps you give them the best possible leads. Those are the leads with the highest probability to convert. Explicit lead scoring helps you refine your sales approach, and prioritize your leads. Advanced lead scoring using no-code machine learning will bolster your sales processes.
Dataset for leads scoring model
When you acquire the lead, it usually includes information like:
- Name
- Demographic
- Tags/comments
- Contact details of the lead
- Source of origin
- Time spent on the website
- The number of clicks
- The number of emails sent
- The number of phone calls/demos
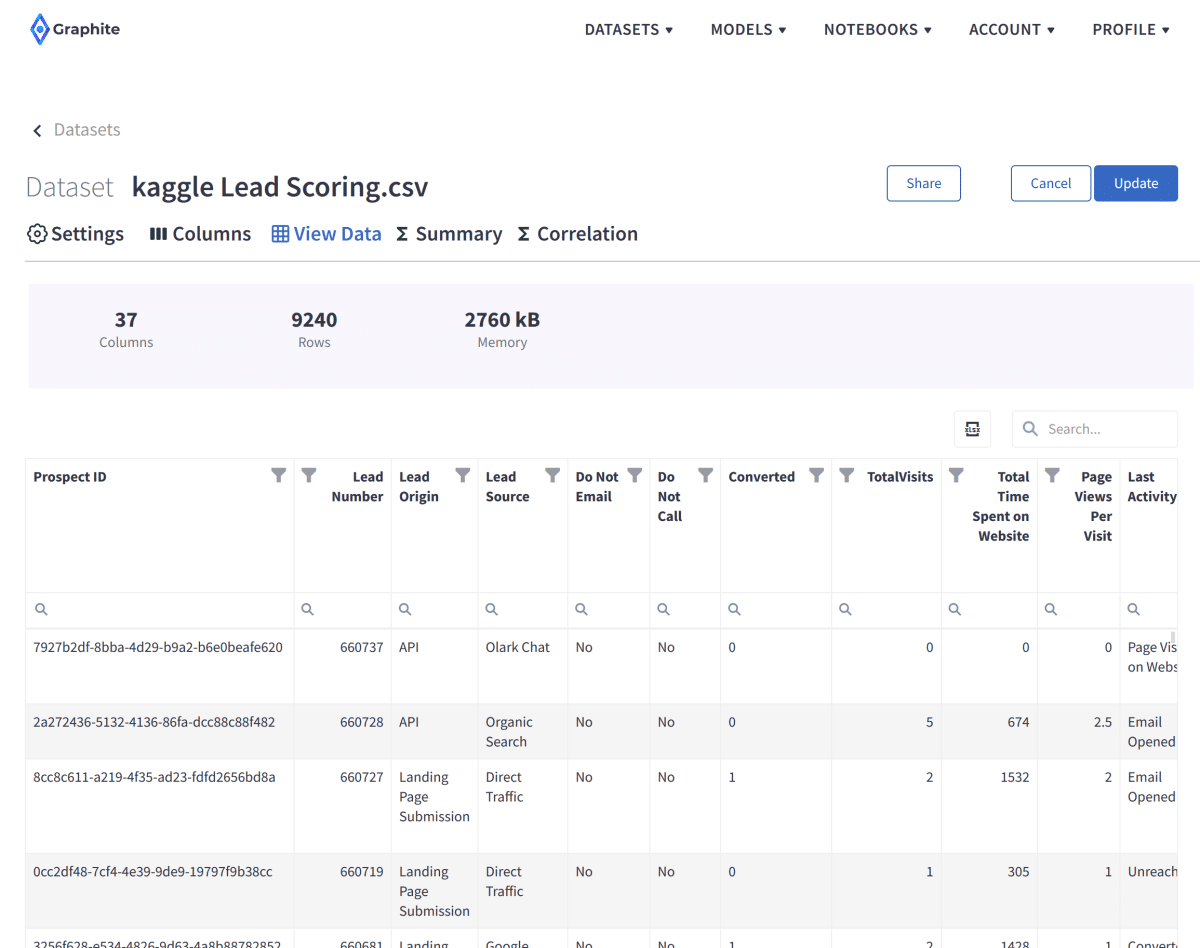
For our example, we are using a popular lead conversion dataset from Kaggle. It contains over 9240 past leads with 37 columns.
Dataset attributes for lead scoring model
The dataset consists of various attributes such as Lead Source, Total Time Spent on Website, Total Visits, or Last Activity. These may or may not help decide whether a lead will be converted. These may help us define the lead scores. Your scoring strategy should align with your business model and objectives. You should also define your lead scoring threshold, and how you assess qualified leads. In explicit scoring, you need to define negative scoring too. You may want to assess all your data points to enhance your explicit scoring. Your common lead scoring approach, and your lead score threshold also play a role in defining how you would assign a lead score.
The most important variable is the column ‘Converted.’ It tells whether a past lead was converted to a customer or not. That variable is important in defining a lead score.
‘1’ means it was converted
‘0’ means it wasn’t converted.
This is a great example of a properly labeled dataset – with column ‘Converted’.
The goal of a lead scoring model
Our goal: the company wants to identify the most potential leads, also known as ‘Hot Leads.’ Once they successfully identify this set of leads, the lead conversion rate should go up. Higher conversion rates lead to higher sales. The sales team will now be focusing more on communicating with the potential leads rather than making calls to everyone. Lead scoring tools can help to focus your business resources more effectively.
Import dataset for the lead scoring model
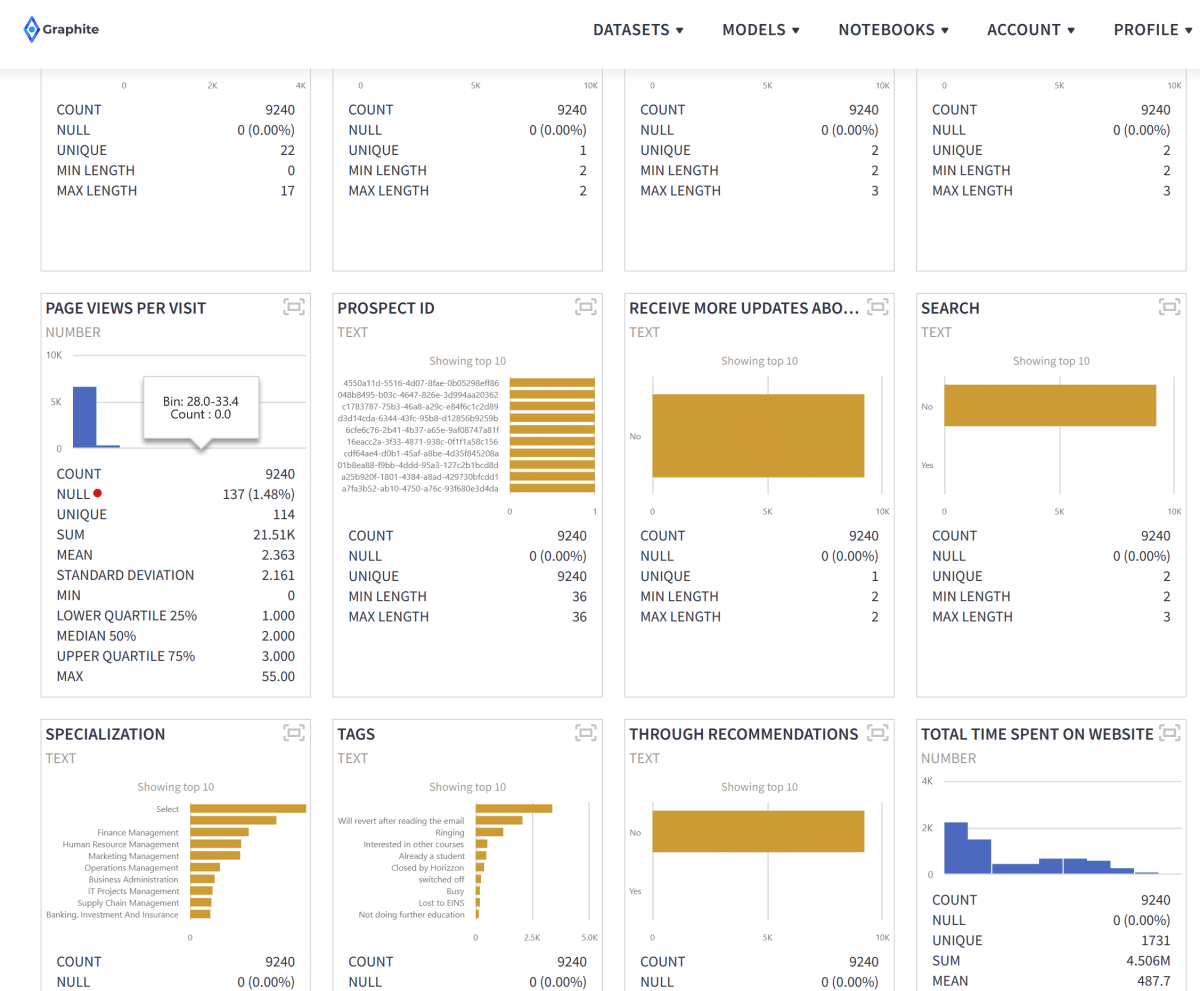
With a few mouse clicks, we imported and parsed a CSV file that we previously downloaded from Kaggle. We can browse through our dataset rows, filter, or search on the View Data tab. We have 37 columns and 9240 rows. Every uploaded dataset in Graphite Note has a practical Summary tab. It enables you to check:
- The distributions of numeric columns.
- The number of null values.
- Different statistical measures.
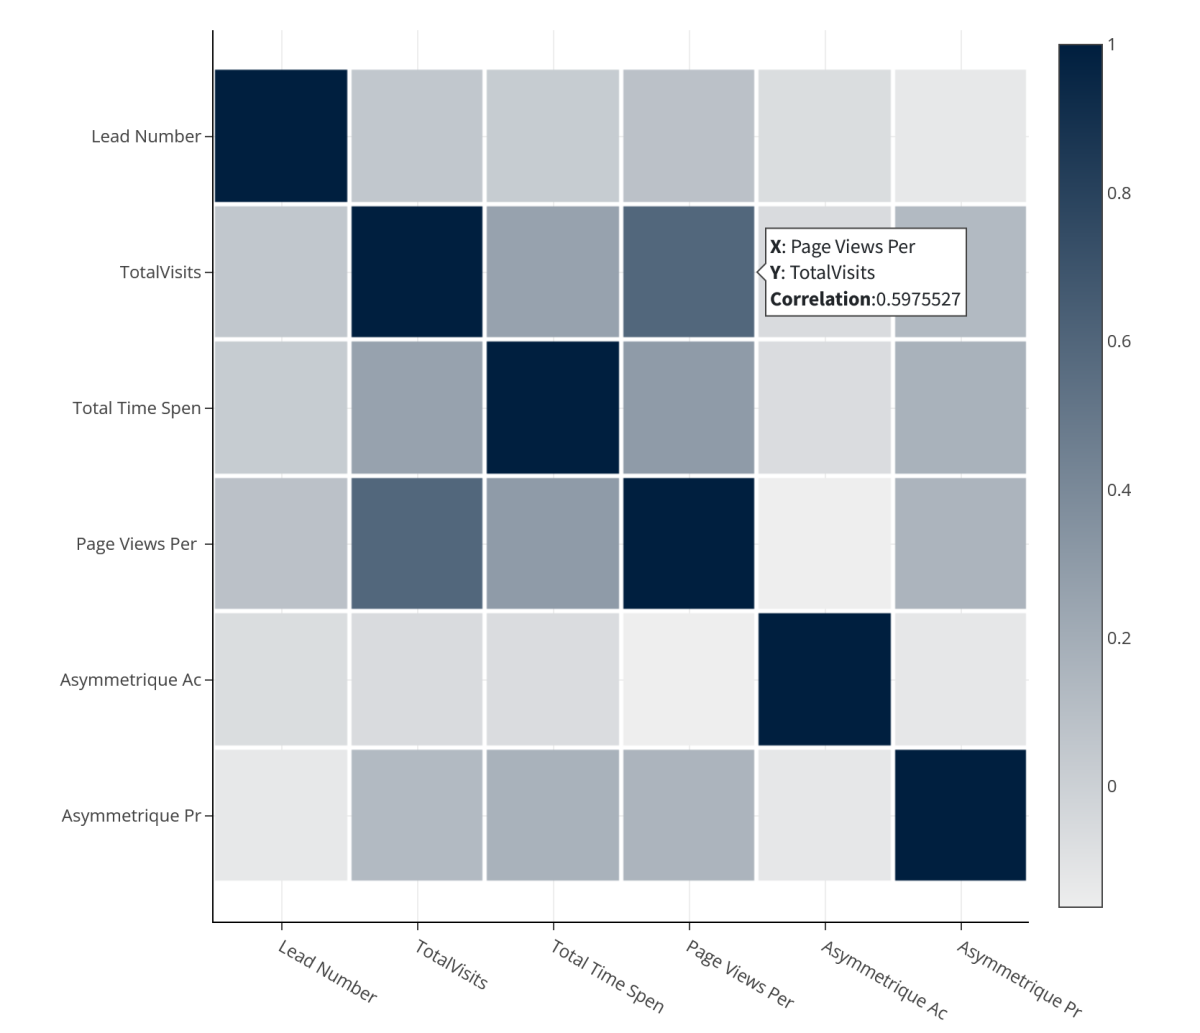
As part of quick exploratory data analysis (EDA), it is always good to check correlations (ready for you on the Correlation tab) in the dataset. This helps you to understand and “feel” the data better.
As part of quick exploratory data analysis (EDA), it is always good to check correlations (ready for you on the Correlation tab) in the dataset to understand and “feel” the data better.
Binary classification in machine learning
Predicting lead conversion is a great use case of binary machine learning classification. Binary, because our target variable we will be training the model for can have only two states – ‘0 – not converted’ and ‘1 – converted’.
Run the no-code machine learning model in Graphite Note
Now we have our dataset uploaded, and we are ready to create a no-code machine learning model in Graphite Note. We chose the Binary Classification model.
In Graphite Note, to build a binary classification model, you need
- A binary target column (what are we predicting, with only two distinct states?)
- A set of features (other columns that have an impact on the target column)
In just a few mouse clicks, we will define a model Scenario.
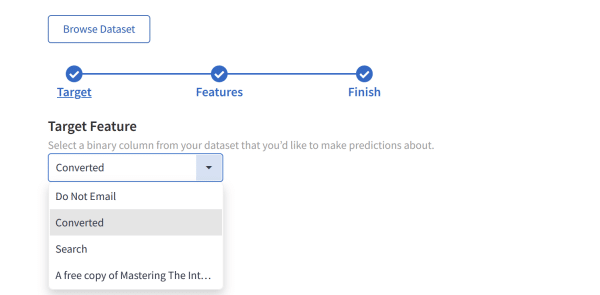
Our Target column from our dataset:
We will select all other columns as features.
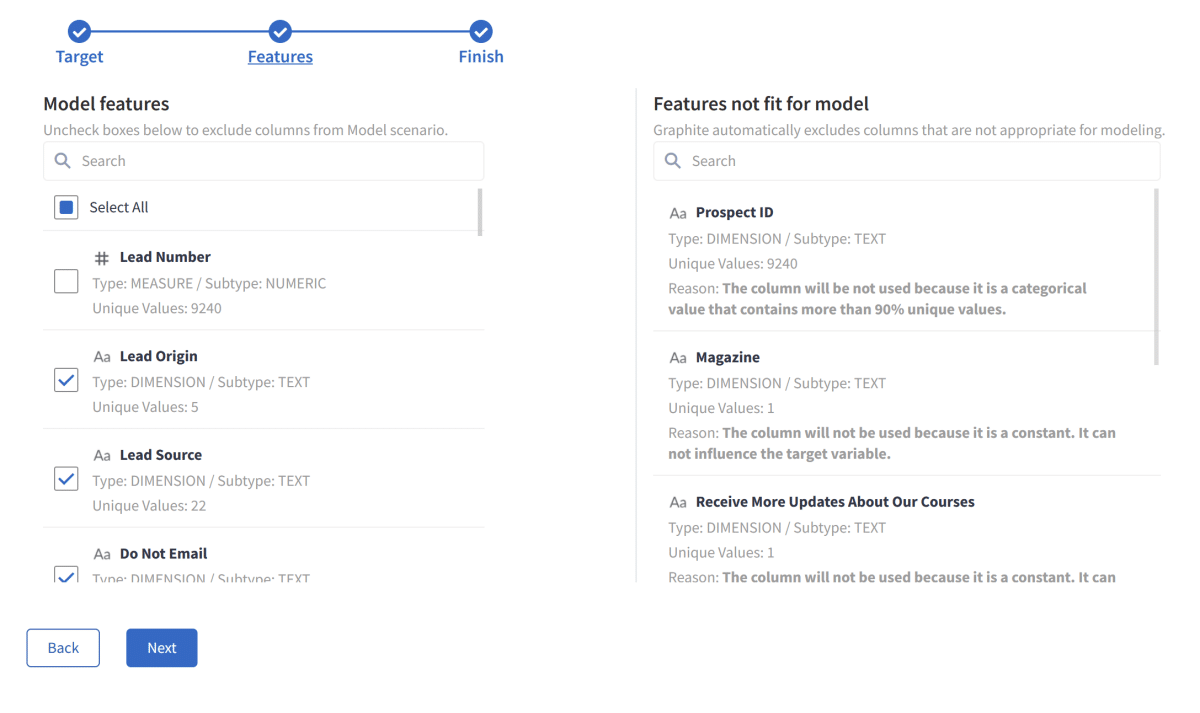
Notice how Graphite Note immediately excluded columns that are not appropriate for modeling. For example:
- Prospect ID: it contains 9240 unique values. The column will not be used because it is a categorical value that contains more than 90% unique values.
- Magazine: The column will not be used because it is a constant. It can not influence the target variable.
Binary Classification Model Results
We will leave all other options on default and run this scenario.
Graphite Note will take care of several preprocessing steps to achieve the best results, so you don’t have to think about them. All these preprocessing steps will occur automatically:
- Null values handling
- Missing values
- One hot encoding
- Fix imbalance
- Normalization
- Constants
- Cardinality
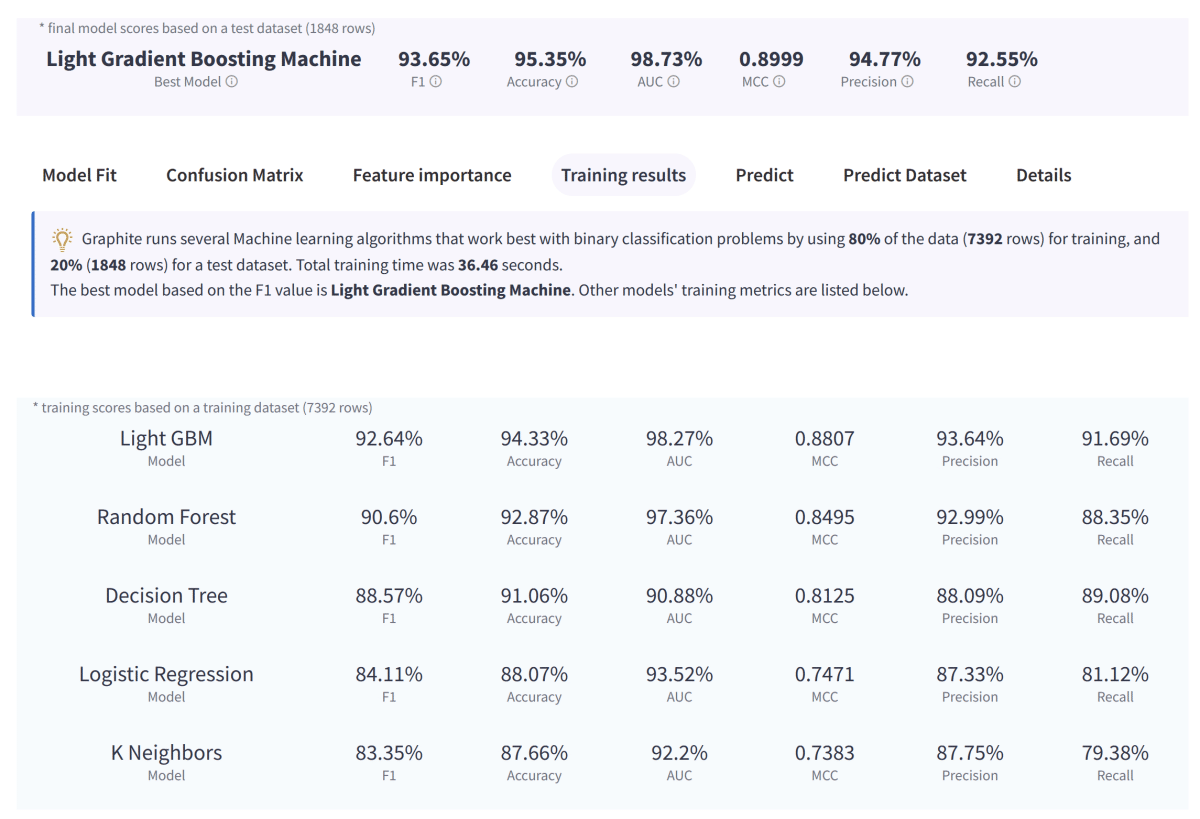
Graphite Note will take a sample of 80% of our data and train several machine learning models. Then, it will test those models on the remaining 20% and calculate relevant model scores. The final best model fit, results, and predictions will be available on the Results tab.
After about 30 seconds, we have our results.
Graphite Note then runs several Machine learning algorithms. These are ones that work best with binary classification problems by using:
- 80% of the data (7392 rows) for training dataset
- 20% (1848 rows) for a test dataset.
The total training time was 36.46 seconds.
The best model based on the F1 value is Light Gradient Boosting Machine. Other models’ training metrics are listed below.
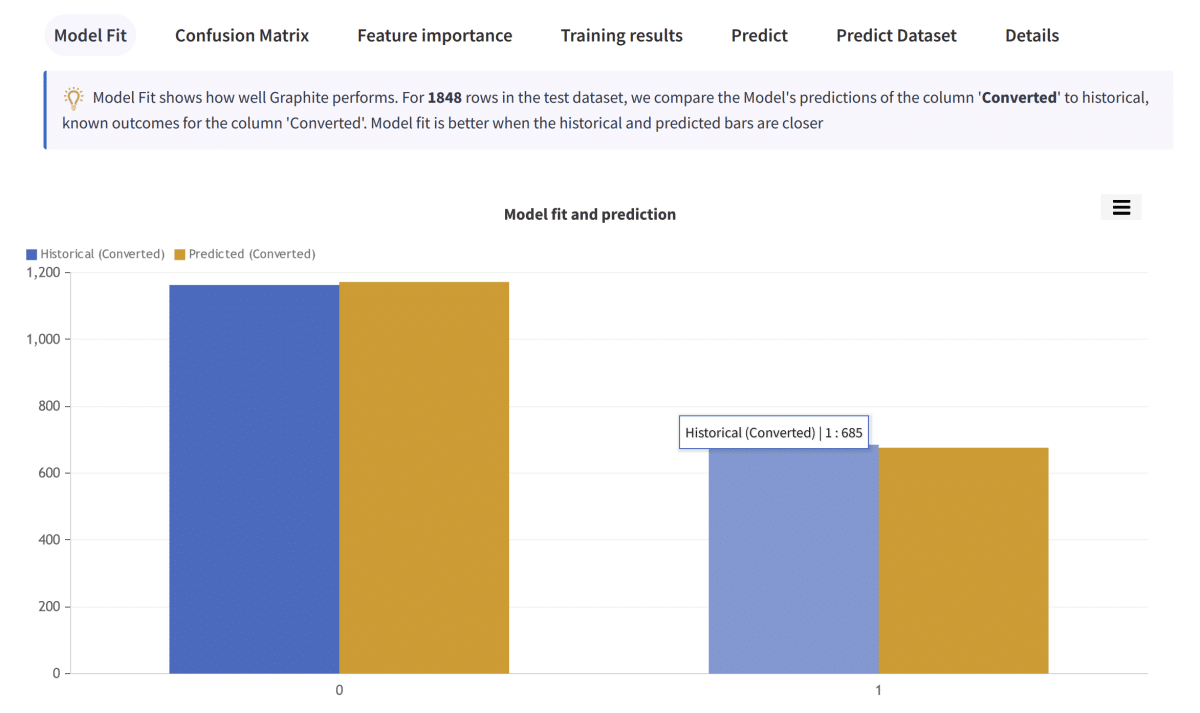
The model Fit tab shows how well Graphite performs. For 1848 rows in the test dataset, we compare the Model’s predictions of the column ‘Converted’ to historical, known outcomes for the column ‘Converted.’ Model fit is better when the historical and predicted bars are closer.
Confusion matrix
The confusion matrix reveals classification errors. A confusion matrix makes it easy to see whether the model is confusing two classes. For each class, it summarizes the number of correct and incorrect predictions. The Model predicted column ‘Converted’ for a test dataset of 1848 rows. It then compared the predicted outcomes to the historical outcomes.
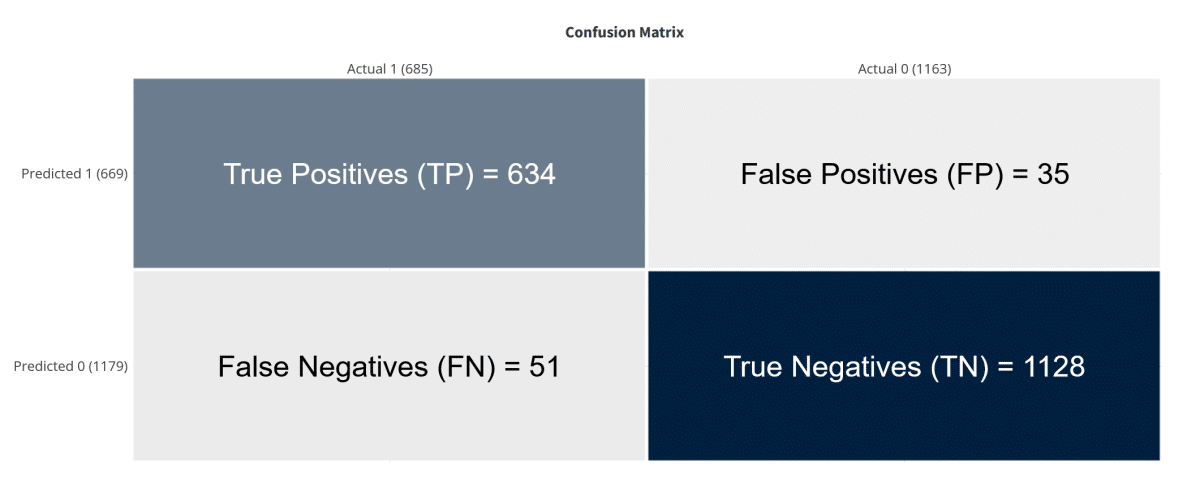
Correct predictions
1762 in total out of 1848 test rows. This is defining Model Accuracy = 95.35%
True Positives (TP) = 634: a row was 1 and the model predicted a 1 class for it.
True Negatives (TN) = 1128: a row was 0 and the model predicted a 0 class for it.
Errors
86 in total out of 1848 test rows, 4.65%
False Positives (FP) = 35: a row was 0 and the model predicted a 1 class for it.
False Negatives (FN) = 51: a row was 1 and the model predicted a 0 class for it.
Other model scores
Please note that we describe predicted values as Positive and Negative and actual values as True and False.
Accuracy, (TP + TN) / TOTAL.
From all the classes (positive and negative), 95.35% of them we have predicted correctly.
Accuracy should be as high as possible.
Precision, TP / (TP + FP).
From all the classes we have predicted as positive, 94.77% are actually positive.
Precision should be as high as possible.
Recall, TP / (TP + FN).
From all the positive classes, 92.55% we predicted correctly.
Recall should be as high as possible.
F1 score, 2 (Precision Recall)/(Precision + Recall).
F1-score is 93.65%.It helps to measure Recall and Precision at the same time. You cannot have a high F1 score without a strong model underneath.
Feature importance
Feature importance refers to how much this model relies upon each column (feature) to make accurate predictions. The more a model relies on a column (feature) to make predictions, the more important it is for the Model. Graphite uses a permutation feature importance for this calculation.
The most important feature is the column “Tags”, then “Last Notable Activity”, “Total Time Spent on Website”, and “Website visits”.
In Graphite Note, it is very easy to check columns like “Tags” in respect to our target column (“Converted”). The most leads that converted have a tag value of “Will revert after reading the email”:
New lead prediction
Graphite automatically deployed the trained model. That means it is straightforward to predict new, unseen data on leads, whether they will convert or not, and the probability of such an outcome.
Imagine that your marketing team informs you about their new lead after you trained the Leads Scoring Model with Graphite Note.

You can check whether that lead will convert and the probability. A powerful tool to keep you focused only on high-quality leads! Your scoring system using no-code analytics has helped you optimize your business processes. By better defining the target market, using previous customer data, the model has created a leads scoring model.
For this particular new lead, Graphite predicted that it would convert (Converted = 1), with a 97 % probability of such an outcome.
Using no-code analytics to create a leads scoring model for your business is simple.

