Precision versus Recall
Introduction
Precision versus recall are important metrics in machine learning. Understanding the difference between precision versus recall is important. This is a guide to understanding precision versus recall. We help you understand the importance of precision versus recall.
Importance of precision and recall in data analysis
Precision and recall are important metrics in data analysis. Precision and recall are metrics used to test how well a model performs. Precision is one of the most critical concepts in machine learning. Precision determines how well a classifier or predictor identifies the things that are relevant to its task. Precision measures the accuracy of positive predictions. Recall measures the ability to detect positive instances. When using precision and recall, it’s essential to be aware of their limitations. Precision and recall aren’t absolute numbers. Precision and recall are measurements in relation to a set of data. These can change depending on what other information might be available. It’s important to try to develop the most accurate machine learning model and minimize your model’s mistakes. Some of your model’s mistakes will have a more significant effect than others. Sometimes, it’s important to know where your machine learning model went wrong.

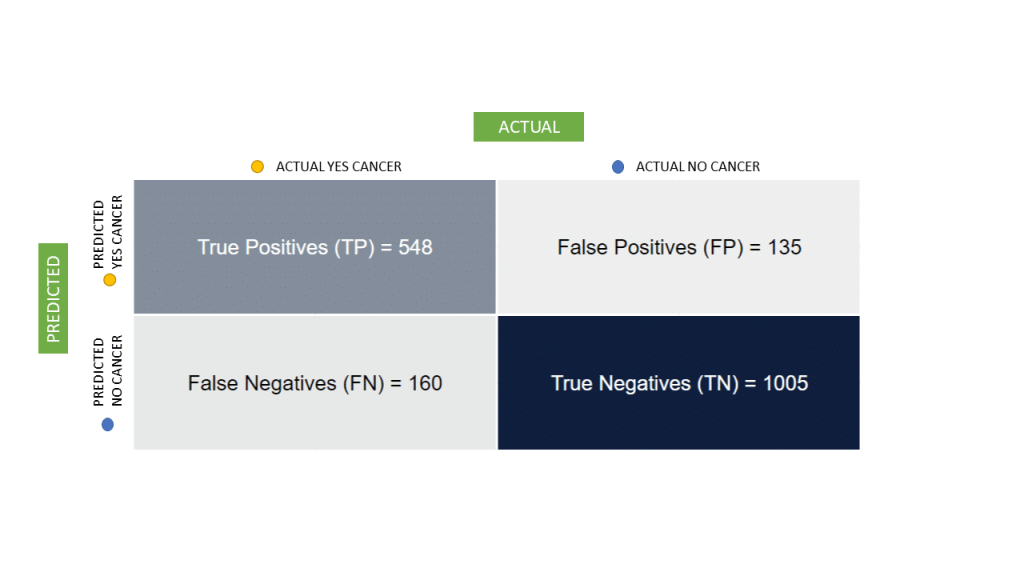
Every machine learning model is wrong sometimes. To illustrate this, we’re going to use an analogy. In this analogy, we will develop a machine learning model. This machine learning model predicts the presence of cervical cancer. Our machine learning model aims to identify as high a percentage as possible of the cancer cases. Our machine learning model aims to do this with as few as possible false positives. A low false positive rate is important. We should not disregard anyone with cancer. This will mean we may flag some patients that do not have the disease as having cancer. This example outlines the difference between focusing on precision versus recall. We must aim to eliminate every false positive.
Definition of precision versus recall
Here are our definitions of precision versus recall:
- Precision is the percentage of correctly predicted instances, relative to the total number of cases.
- Recall is the percentage of correctly predicted instances, in relation to the total number of relevant cases.
High precision and high recall mean that your model is performing well.
Definition and of precision
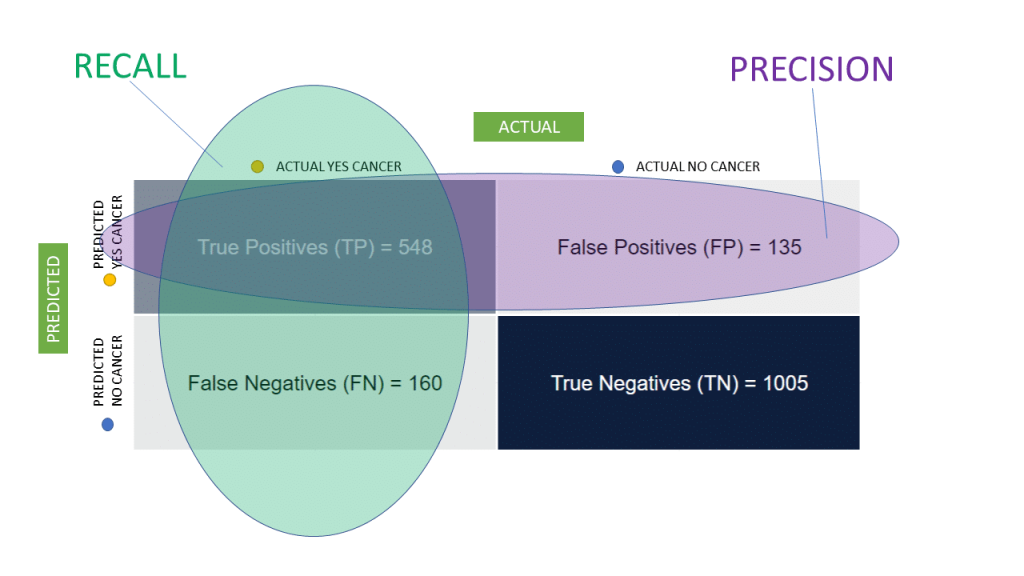
Precision is the proportion of true positives to all positive predictions. Precision includes false positives and true markers. Using our analogy: Out of all patients our model predicted as having cancer, how many actually do have cervical cancer? Low precision means that our machine learning model will predict some false positives. Our machine learning model will incorrectly label some patients as having cervical cancer. It’s not ideal, but that type of error is not life-threatening.
Formula and calculation of precision

Precision is also known as a positive predictive value. Precision measures how well a classifier predicts the positive class. You calculate precision by taking the number of true positives, and dividing it by the total number of all observations. This value ranges from 0 to 1. A higher score indicates better balance.
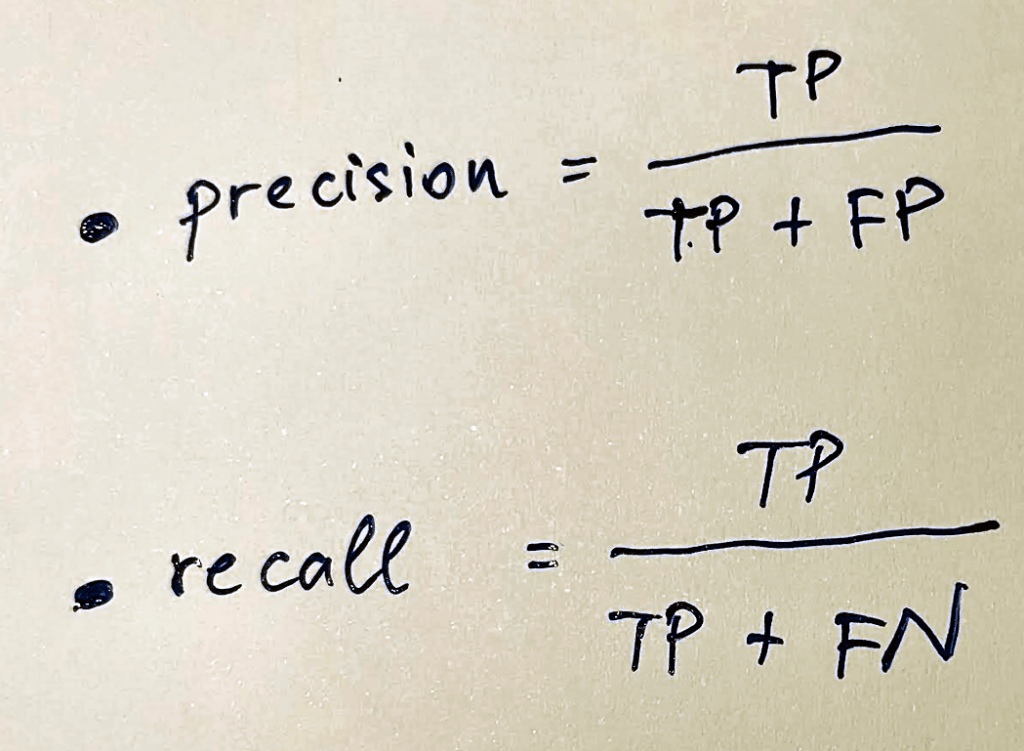
Precision, TP / (TP + FP).
From all the positive classes, 69.15% we have predicted as positive are actually positive.
Precision should be as high as possible.

An example of precision
The same principle applies to other types of predictions too. For example, if you’re trying to predict a person’s height, testing once might lead you to an incorrect prediction. The person may have been wearing thick-soled shoes at the time you tested. If you test many times, by measuring their height while wearing various footwear, it becomes easier to find an average measurement. That measurement is more accurate than any single measurement.
Definition of recall
Recall is a way to measure how many correct items were found compared to how many were actually there. Recall is also known as sensitivity. You calculate recall by dividing the number of positive samples correctly classified as positive by the total number of positive samples. Recall measures a model’s ability to detect positives. The higher its recall, the more positives that are detected. We refer to our analogy again: out of all the patients that do have cancer, how many were predicted correctly?
Low recall means that our machine learning model will predict some false negatives. Our machine learning model will label some patients that really do have cancer as not being sick. That type of error is life-threatening.
Formula and calculation of recall
To calculate recall, you must first determine what is a positive sample within your data points. In line with our analogy, a positive is a patient who has cervical cancer. You can then use your model to classify patients as positive or negative. After that, count how many patients were correctly identified as having cancer. Finally, divide that number by all the patients whose status was definitely known. This will give you an accurate reading of how well your algorithm detected positives.
Recall, TP / (TP + FN).
From all the positive classes, 67.71% were correctly predicted.
Recall should be as high as possible.
Importance of recall in different scenarios
Recall metrics tell you how well your model identifies all the true positive cases within your data set. Recall is important because it:
- Minimizes false negatives: False negatives occur when your model misses a true positive case. Minimizing false negatives is key, as missing relevant information can have serious consequences. This means you are more likely to achieve a true positive rate, and a true negative rate. Don’t forget, you also don’t want to miss out on detecting the true negatives.
- Ensures completeness: High recall ensures that your model captures a comprehensive picture of the data. This is especially valuable when dealing with rare or imbalanced datasets.
- Builds trust: When your model has high recall, it’s not overlooking important information. This builds trust in the results. This allows you to make informed decisions based on a complete understanding of the data.

An example of recall
To use a simple example, let’s imagine you want to evaluate 500 pictures, to determine how many have a cat in them. You will likely miss some because the cat is hidden in the background or too small to be evaluated. In this case, your recall rate is lower than your precision rate. It’s not always possible to find every single item or data point, so a 100% high recall rate is rare. But you want your percentage to be as high as possible.
Differences between Precision and Recall
Precision:
- Focuses on accuracy: Precision measures the proportion of your predicted positive cases that are true positives.
- Trade-off with recall: Increasing precision often means sacrificing recall. This is because you become stricter in defining a positive, and could miss identifying some true positives.
- Applications: Precision is crucial when the cost of false positives is high.
Recall:
- Focuses on completeness: Recall measures the proportion of all true positive cases that your model correctly identifies. Recall tells you how many of the actual positives your model catches.
- Trade-off with precision: Increasing recall often means sacrificing precision. You become more relaxed in what you call positive, often including some false positives.
- Applications: Recall is critical when the cost of missing true positives is significant.
How precision and recall complement each other
Precision and recall complement each other in valuable ways:
- Provide a holistic view: Neither precision nor recall alone paints the entire picture. Precision tells you how accurate your positive predictions are, but it doesn’t tell you how many true positives you missed. Recall focuses on catching all the true positives but doesn’t guarantee their accuracy. Together, they offer a two-dimensional perspective on your model’s performance.
- Guide model optimization: Analyzing precision and recall helps you understand your model’s strengths and weaknesses. If your recall is low, the model might be too picky and missing valid positives. Conversely, low precision indicates it’s too eager and flagging irrelevant cases. By considering both metrics, you can fine-tune your model parameters. Considering precision and recall helps you adjust thresholds. Taking precision vs recall into account can help you choose different algorithms too.
- Inform decision-making: Prioritizing one metric over the other might be necessary. Analyzing both metrics helps you make informed decisions about prioritizing accuracy or completeness.
- Highlight trade-offs: Precision and recall have an intrinsic tension. When you optimize for one, the other often suffers. By considering both, you can find the “sweet spot” that best suits your specific needs. You can assess the precision curve or the recall curve to help you find the right balance.
- Enable informed communication: When reporting model performance, presenting precision and recall paints a more nuanced picture. This enables people to understand the strengths and limitations of your machine learning model.
Find the right balance between precision and recall
The “right” balance between precision and recall depends on the specific context and the consequences of errors. Finding different ways to balance precision and recall is key, and ensuring you’re using the relevant data points. Choose the metric that aligns best with your priorities and the potential risks involved. Then, and you’ll be on your way to making correct predictions. Precision and recall are two key concepts for understanding how machine learning algorithms work. Precision and recall will help you understand how well your classifiers’ identify patterns in data. Precision and recall improve your models by making sure they recognize all relevant information and ignore irrelevant data.
F1 Score Machine Learning
F1 score is a powerful way of measuring a model’s performance. It combines two metrics: precision and recall.
It is calculated as follows:
Image by the Author: F1 score formula
F1 score, 2 * (Precision * Recall)/(Precision + Recall).
F1-score is 68.42%. It helps to measure Recall and Precision at the same time. You cannot have a high F1 score without a strong model underneath.
Let’s repeat what we’ve learned so far.
Precision is the percentage of relevant results your model returns. It measures how accurate your model is at identifying the correct answer instead of returning any result that could be considered a match to what you’re looking for.
Recall, on the other hand, measures how much of your search results were relevant. It tells you whether or not your search should have returned any results at all.
The F1 score is a weighted average of precision versus recall. One point is added to precision if the result is relevant, and one point is added to recall if at least one result is relevant. The resulting value gives you an idea of how closely your model matches what was searched for.
The F1 score is a good metric for evaluating search results because it gives you an easy way to compare different models. If you have two models with very similar precision versus recall scores, it’s hard to say which one is better.
With the F1 score, you can compare them with a single metric by weighing their respective scores equally. It gives more weight to false positives and false negatives, which are false predictions that will significantly impact accuracy and precision.
The best way to use the F1 score is to compare your results against a baseline model. If you’re trying to improve your model’s performance, comparing it with a baseline model with an F1 score of 0.5 or higher will help you see how much better (or worse) it performs.
You can also use the F1 score as part of a statistical hypothesis test to determine whether your improvements can make a difference in real-world use cases.
Transform your business with Graphite Note’s prebuilt machine learning models that work with any dataset, regardless of industry. Our data-agnostic platform delivers insights and predictions in minutes, giving you a competitive edge. Explore high-impact use cases that drive real business outcomes:
Key Use Cases:
1. Lead Scoring: Prioritize high-quality leads and increase conversion rates. Customer Churn Prevention: Retain more customers by identifying those at risk of churning.
2. Cross-Sell Optimization: Boost sales by targeting customers likely to purchase additional products.
3. Time Series Forecasting: Optimize inventory and plan for sales peaks and low periods.
4. Customer & Product Segmentation: Segment customers for personalized strategies and sales growth.
5. Customer Lifetime Value: Predict customer value over time to maximize revenue.
6. Predictive Maintenance: Reduce downtime, cut costs, and extend machinery life. Start leveraging Graphite Note today for smarter decisions and faster results!
Try it for free and see how predictive and prescriptive analytics can revolutionize your strategy.


