What is Data Storytelling and why is it important?
Data storytelling takes raw data and turns it into an interesting, easy-to-understand story. Data storytelling helps you communicate insights from data. Data storytelling helps you communicate more effectively with your audience.

What are dashboards?
Your dashboard is a tool that is used for data analysis. Using a dashboard helps you showcase raw data. Using a dashboard also enables you to tailor the information you want to have displayed.
Dashboards include interactive features and filters. You can use these to highlight valuable insights. Your data story can be told using charts, graphs, and reports. Dashboards can have some limitations. That’s why many businesses are turning away from dashboards. Businesses like yours are now adopting data storytelling, to tell a good data story.
The downside of dashboards
Dashboards, while useful, don’t always help you to tell a good story. Dashboards are often set up without the end user in mind. Dashboards are also often set up with a set of assumptions and priorities. These priorities may not be what’s most useful to the end user. Businesses end up with data dashboards that don’t work for their business objectives. Ensuring all the raw data is clean and optimized for the dashboard is difficult.
Dashboards and ROI
Data isn’t universal, so compatibility and connectivity remains a challenge. To bridge this gap, users must input data manually, which defeats the goal of the dashboard. The user experience is often poor with a dashboard. Dashboard licenses can also be expensive and equate to a good Return on Investment (ROI). Dashboards should measure the metrics that matter, and that is not always possible. Dashboards also present data in a bad way, unless you can add visual elements to it. That’s where data storytelling steps in. Effective data storytelling is the way to communicate data insights gleaned from your raw data. Next, we’ll guide you on how to create a good data story.
What is data storytelling?
Data storytelling takes data and combines it with a compelling narrative. This creates a data story. Data storytelling converts information into a data story that anybody can comprehend. A data story presents a clear, concise message. Effective data storytelling helps you showcase your data insights. You can use your data storytelling skills to better communicate with your stakeholders.
Metrics become actionable data insights
Data storytelling is the ideal way to communicate your data analysis insights. Data storytelling lets you use data sets and metrics. You convert them into actionable and beneficial insights and present them in the form of a data story. Data storytelling examines the key performance indicators that align with your business objectives. Data storytelling converts quantitative information into a result-driven narrative. The data story is far easier to understand and communicate. You can use data storytelling rather than sharing a spreadsheet of data points, complex data, or big data.
Enhance engagement and communication
Data storytelling helps you communicate more effectively. Combining data presentations, data visualizations, data analytics, to create a visual representation. The power of a good data story helps you overcome communication challenges, with ease. Using data storytelling techniques, you can gather and examine data. Then, you can present data insights in the form of easy-to-understand and engaging visuals and narratives.
The data story
The data story leads to a far more engaging conversation and data presentation. This creates compelling narratives to underline the effect of your business operations. With compelling narratives on your side, it’s far easier to communicate the outcomes of your business operations. Data storytelling helps you showcase how you are achieving your business objectives. Your data insights are far more effective. A good data story also helps you show your products, services, and business operations to customers. Rather than relying on raw numbers, you can communicate key insights with a structured approach. You can communicate valuable data insights and compelling data. This prevents you from having people be confused by vast amounts of data. This is a good business decision. Your data story is a powerful tool and effective way to promote positive change and key elements of your accurate data.
Enhance business processes
Data stories feature a defined plot with a well-constructed introduction, end, and middle. Data storytelling templates, tools, and platforms have pre-set formats and themes. These are used to alter the visualization and story depending on the input data. This also ensures the message is expressed most effectively. Data storytelling examples take raw data and turn it into an engaging data story that people can understand and connect with. You can delineate a data story plot, and develop a data story framework. First, you must consider your objective for your data story, and then align it with your organizational goals or strategy. Populating the plot with relevant KPIs and data visualisations can enhance your efficiency and productivity.
Data visualization
It can be difficult to present data in an engaging way. It’s important to ensure your data storytelling example has a visual appeal to attract interest and be effective. Data science can help, but not all data scientists can tell a data story. Presenting complex data with a compelling narrative is the way forward. Data storytelling uses visuals, line graphs, pie charts, and bar charts. These are used to communicate your business’ valuable insights. Data visualization tools are an excellent business intelligence tool. They move you beyond simply presenting raw data and towards effective communication. Data presentations become more interesting and appealing. A good data story communicates your results in an effective way.
Effective communication
You know your metrics and have your ways of obtaining that raw data. To communicate the meaning of that accurate data, however, is where it gets difficult. Effective data communication helps you present data in a relatable way. However, the minute you have to communicate what matters to others, things crumble. With data storytelling, you don’t have to worry about the explanation. It’s far easier to get everybody on the same page.
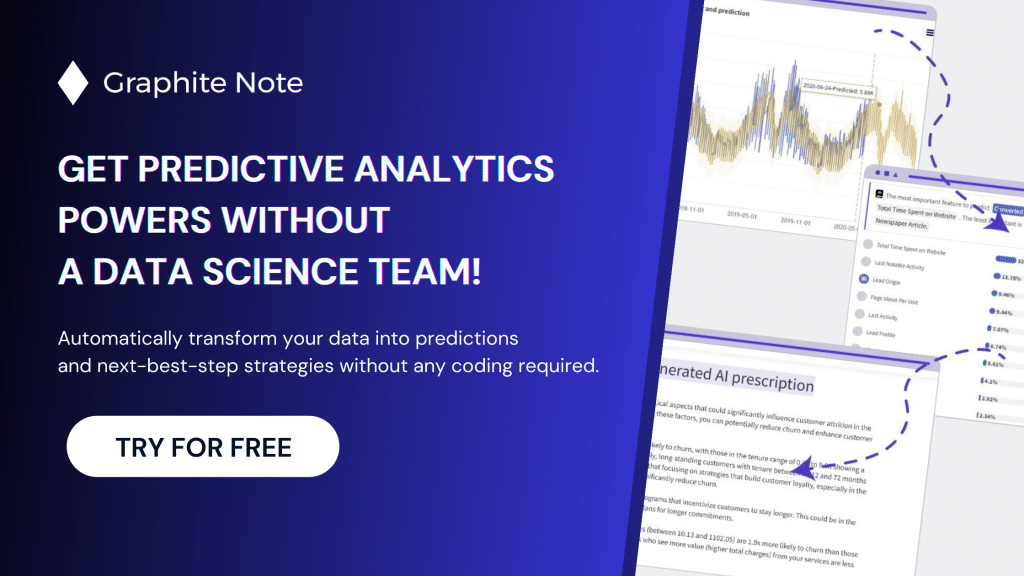
Dashboards can be useful for showcasing raw data to your business users. They are not always an effective mode of communication. Using key elements to tell a good data story aligns with business best practices. You can present complex information in an effective way. Data storytelling helps you highlight key results, key insights, and key components. At Graphite Note, our data experts combine traditional analytics, predictive analytics, and data storytelling.