
What is data storytelling?
Data storytelling is the art of turning complex data into a compelling narrative. Data storytelling uses data analysis, data visualization, and clear communication to share insights with an audience.
Yes, the charts are important…
For every executive who is about to pull up the first slide of a presentation in a boardroom filled with eager associates, there is usually that moment just before speaking when nerves fray, last-minute doubts fill the mind, and fear of failure can weaken the resolve. Did I choose the right image to start with? Is the text too small to read? Is the right tone conveyed throughout the presentation? Let’s go through the importance of data storytelling for business.
The usual recommendations of how best to present data most effectively crowd into the mind — don’t clutter, choose relevant KPIs, keep it simple, choose layouts carefully, less is more, and be cautious with colors.
… but the key is an emotion
These are all helpful ideas, but none of them can hold a candle to the most important concept of all: emotion.
You see, whereas brains are built for visuals, hearts turn on stories.
Visualization might be important, but the emotion is key. If you want to sell a story, send a missile to the heart.
Don’t get me wrong, I believe in the power of graphs and charts. Stacked columns, line charts, waterfall, and scatter plots all have their place in data presentation. At its core, however, data visualization is a tool that transforms data into actionable insight by using it to tell a story.
Charts can be the start, not the end of the communication.
Jerome Bruner claims that we are 22 times more likely to remember a fact when it has been wrapped in a story. Successful data storytelling is a powerful force. Effective data storytelling takes statistics and metrics, and puts them into context. Then, using data storytelling skills, your data storytelling compiles a relevant narrative that everyone inside or outside of an organization can grasp.
Human beings are, first and foremost, visual creatures. Our brains are built for visual information as the following data shows:
- 90% of the information processed by the brain is visual. A good data story shifts the needle of your presentation.
- It takes only 13 milliseconds for the human brain to process an image. A compelling data story sticks!
- The human brain processes images 60,000 times faster than text. Data stories are a must for communicating with your team.
- 80% of people remember what they see, compared to 10 percent of what they hear and 20 percent of what they read. There are data storytelling examples aplenty that prove this.
- In response to a recent survey, 95% of B2B buyers said that they wanted shorter and highly visual content. That’s why you need to become an effective data storyteller.
- Publishers that feature visual content grow traffic 12 times faster than those who don’t. Compelling narratives help you get the message across.

The use of emotion makes data presentation unforgettable too
As Carl Bucher once stated, “They may forget what you said, but they will never forget how you made them feel.”
“Out of clutter, find simplicity,” said Albert Einstein. This is a great motto for presenters. Simple messages resonate deeply if extraneous items are being stripped away.
Emotions cut through the clutter like nothing else.
Before putting any design elements in place, think about the end goal. What are the most important elements that need to be showcased? Who is the audience? What is the emotional punch you want to be conveyed on the final slide? To build successful dashboards, a designer needs to put himself in the audience’s shoes.
Designers should always try to provide maximum information. Without the right context, numbers that might seem extremely obvious to one person might be perplexing to others. Your raw data matters, but your data insights matter more. A clear data story moves beyond data analysis, and a conglomeration of data points. Turning big data into a compelling narrative using data visualization tools is a must fro your business.
All the axes should be named, and titles should be added to all charts. Comparison values should also be included. The rule of thumb here is to use the most common comparisons, for example, comparison against a set target, against a preceding period, or against a projected value.
Comparisons also add emotion as they provide benchmarks of understanding.
It is easy to recognize the emotional power of a line chart that reveals sales falling off a cliff. Or taking off into the ether.
The artist Kenneth Noland once said, “For me, context is the key — from that comes the understanding of everything.”
Without providing context, it’s impossible to know whether numbers are good or bad, typical or atypical.
Without comparison values, numbers on a dashboard are meaningless for viewers. And more importantly, users won’t know if any action is warranted.
Design: Intelligence Made Visible
Dashboard design best practices concern more than just good metrics and well-thought-out charts. The second step of dashboard design is the placement of charts on a dashboard. If your dashboard is well organized visually, information can easily be found.
Poor layout forces users to think more as they try to grasp a point the presenter is trying to make. Nobody likes to look for data in a jungle of charts and a maze of tangled numbers.
The general rule is that the key information should be displayed first — on the top of the screen, upper left-hand corner. Most cultures read from left to right, then from top to bottom, which means viewers intuitively look at the upper-left part of a page first and read down from there.
“Color is a power which directly influences the soul,” states the famous Russian artist Wassily Kandinsky. Who can argue with one of the greatest painters and art theorists of the 20th century? Color is used by advertisers everywhere to convey an emotional message that resonates deeply within any audience. Without a shadow of a doubt, the use of color is one of the most important best practices in dashboard design.
Graphite Note Proposition
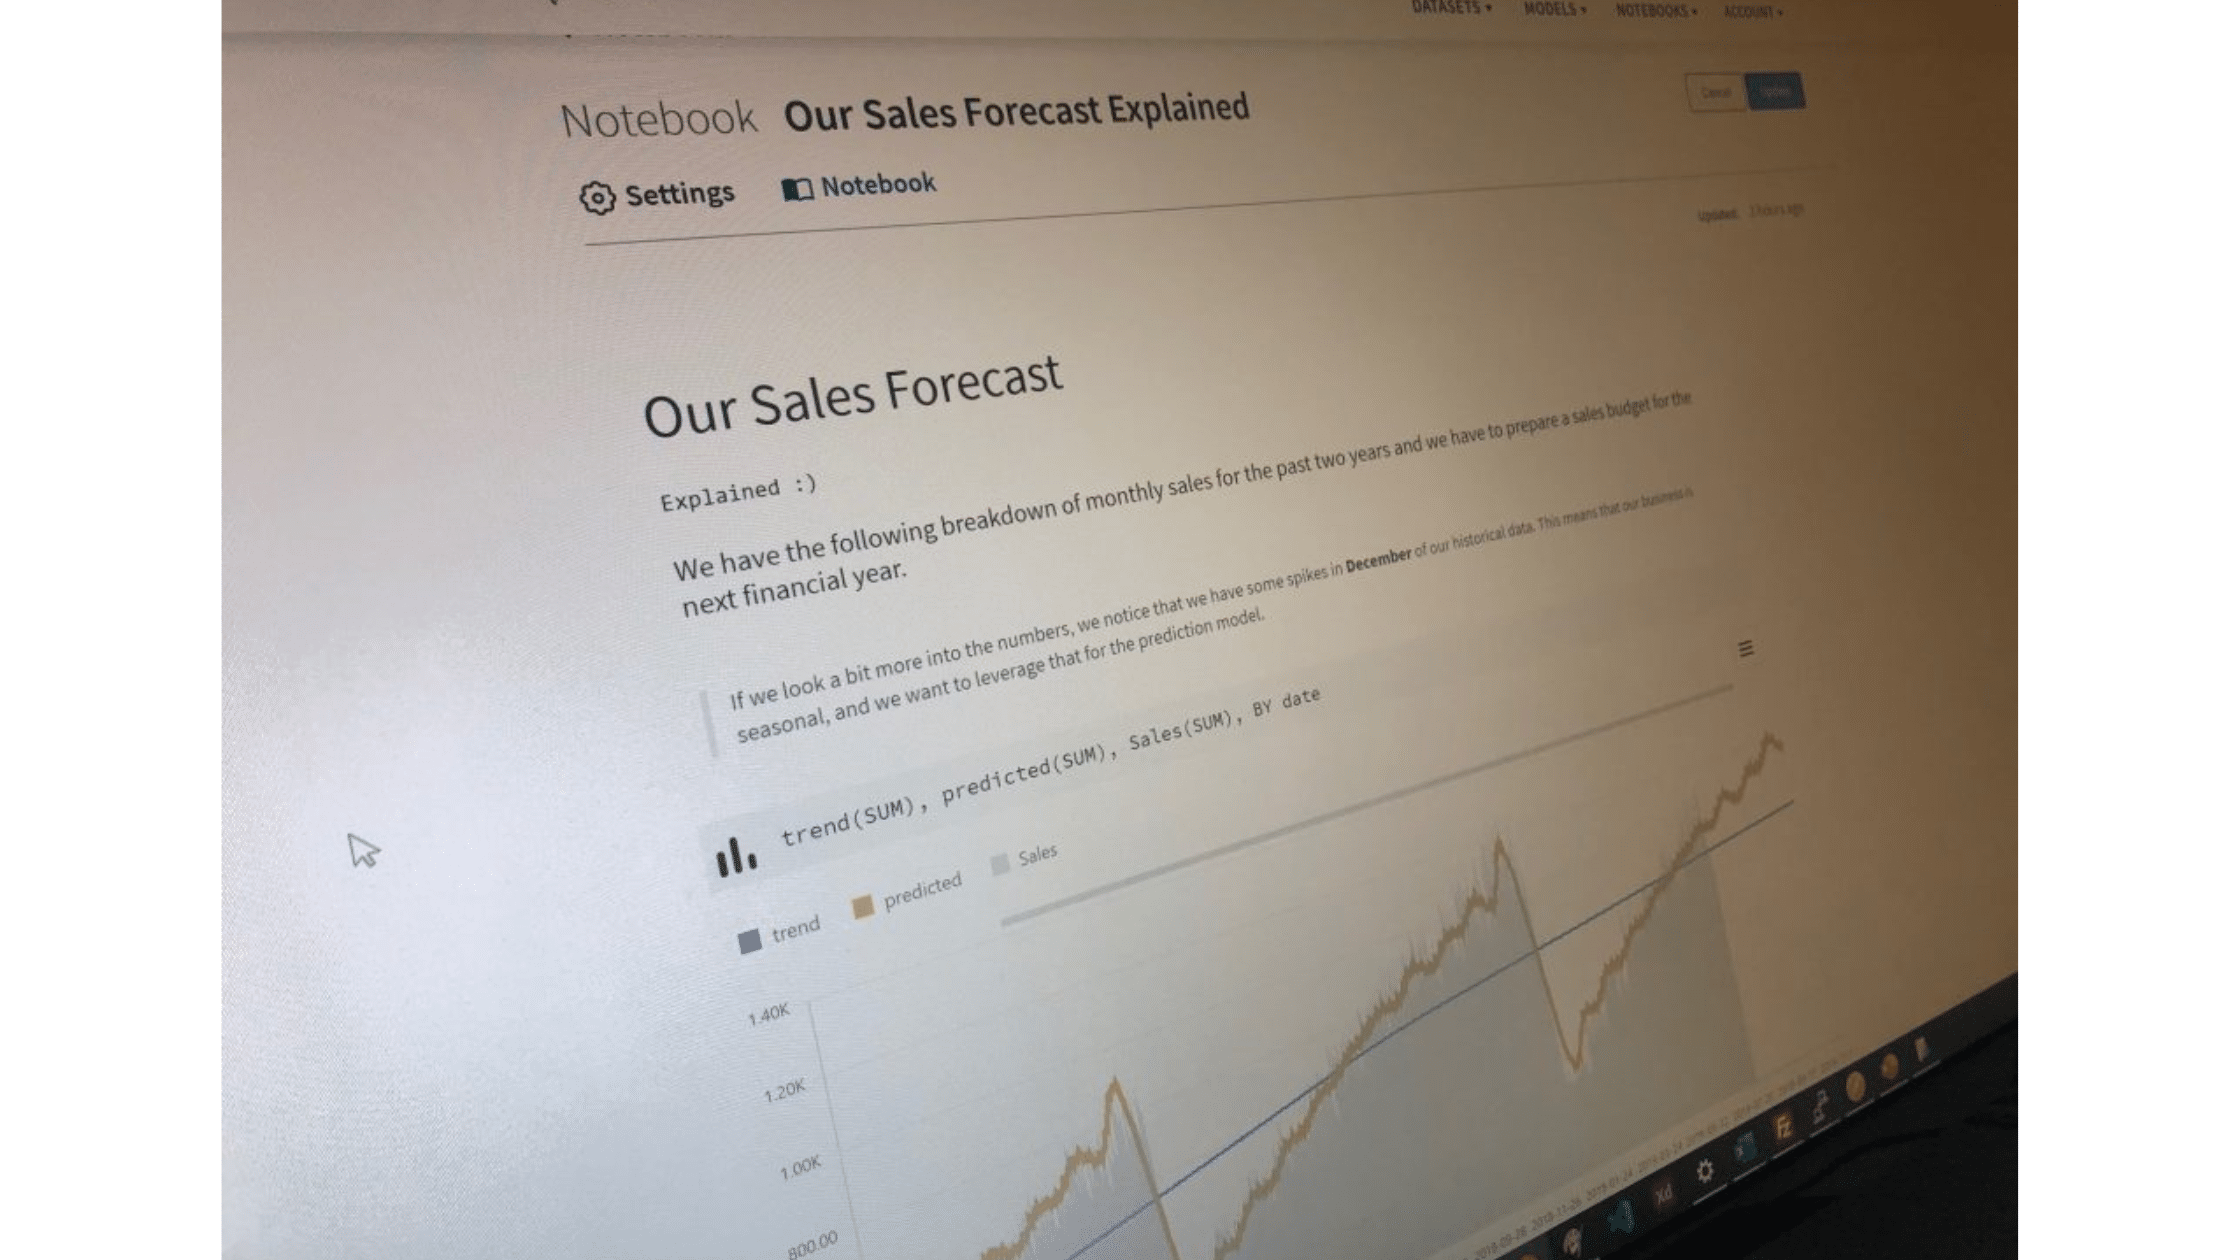
Graphite Note proposes that data analytics to “go vertical”, so there will be much more natural, easier to explain insights and conclusions, by design.
You have a title text block, graph block, predictive analytics block, explanation text block, several graph blocks, and so on. Combining visuals and narrative together to create a memorable data story.This will allow data analysts to explain the whole process beautifully, to tell a data story, and to engage the audience (your team). And that will, in turn, supercharge decision making, because decisions are made on an emotional level, where the story hits.
Data storytelling for business
Of course, you don’t need to go all Joseph Campbell Hero of a Thousand Faces with your presentations. Charting a mythical story filled with a mixture of heroes, mentors, tricksters, shapeshifters, guardians, and shadows isn’t the goal, but recognizing how myth can turn each story point — or chart— is. Understanding the power of the story adds a subtextual level to any data presentation that, although not recognized by an audience, will pull on their emotions.
Dale Carnegie once said, “There are always three speeches for every one you actually gave. The one you practiced, the one you gave, and the one you wish you gave.” Utilizing proper data presentation techniques and wrapping emotion into the power of storytelling will help ensure that the speech you give is not separated into three but combined into one.
Above all else, it will be the speech you had wished you had given and you won’t suffer pangs of regret or wishful thinking afterward.
Emotion is a tricky element to include and it must always, always, always be united with the truth. However, if you can wrap your data storytelling presentation in a compelling story, you’ll not only touch your audience’s heart but also have them eating out of the palm of your hand.

Graphite Note helps you tell the right data story. Try our data storytelling techniques to help you communicate the key components of your insights. You’ll make better decisions, and share valuable insights with your team.