
Tesla Stock Price Prediction
Tesla Stock Price Prediction
Everyone knows who who Tesla – the person, inventor – was, and who Tesla – the company – is.
We’re assessing the tsla stock price here. We’ll use Graphite Note to create a Tesla stock price prediction (TSLA), by using its time-series no-code machine learning Model.
- Tesla Stock Price Prediction
- Dataset for Tesla Stock Price Prediction
- Time series Forecast
- Time series Forecast Model in Graphite
- Run the ML Model – Tesla Stock Price Prediction
- Conclusion
Tesla’s mission is to accelerate the world’s transition to sustainable energy. Tesla was founded in 2003 by a group of engineers. They wanted to prove that people didn’t need to compromise to drive electric cars. Electric vehicles can be better, quicker, and more fun to drive.
Dataset for Tesla Stock Price Prediction
Our goal is to predict the future tsla stock price, based on historical data. We pulled historical prices from publicly available sources and build a stock price forecast. We pulled data for the past 365 days from Yahoo! finance.
Here is historical data, from 2020-01-01 – 2022-09-01:
We can clearly see all ups and downs in price dynamics. We could also use data from Wall Street analysts, or CEO Elon Musk himself.
Let’s use this dataset to predict what will the stock price be in the next 365 days. We start by uploading the dataset into Graphite Note.
In a few mouse clicks, we imported and parsed a CSV file that we downloaded from Yahoo! finance. These are the dataset columns:
We can browse through our dataset rows, filter, or search on the View Data tab. We have 7 columns and 673 rows. Since we downloaded more days, it is clear that some dates are missing from the dataset. Graphite Note’s time series Model is built to handle missing dates.
Every uploaded dataset will have a practical Summary tab. This enables you to check distributions of numeric columns, the number of null values, and different statistical measures. For example, we can spot that for the closing price (CLOSE column), most dates (157 dates) belong to a bin with price CLOSE values from 217 to 256.
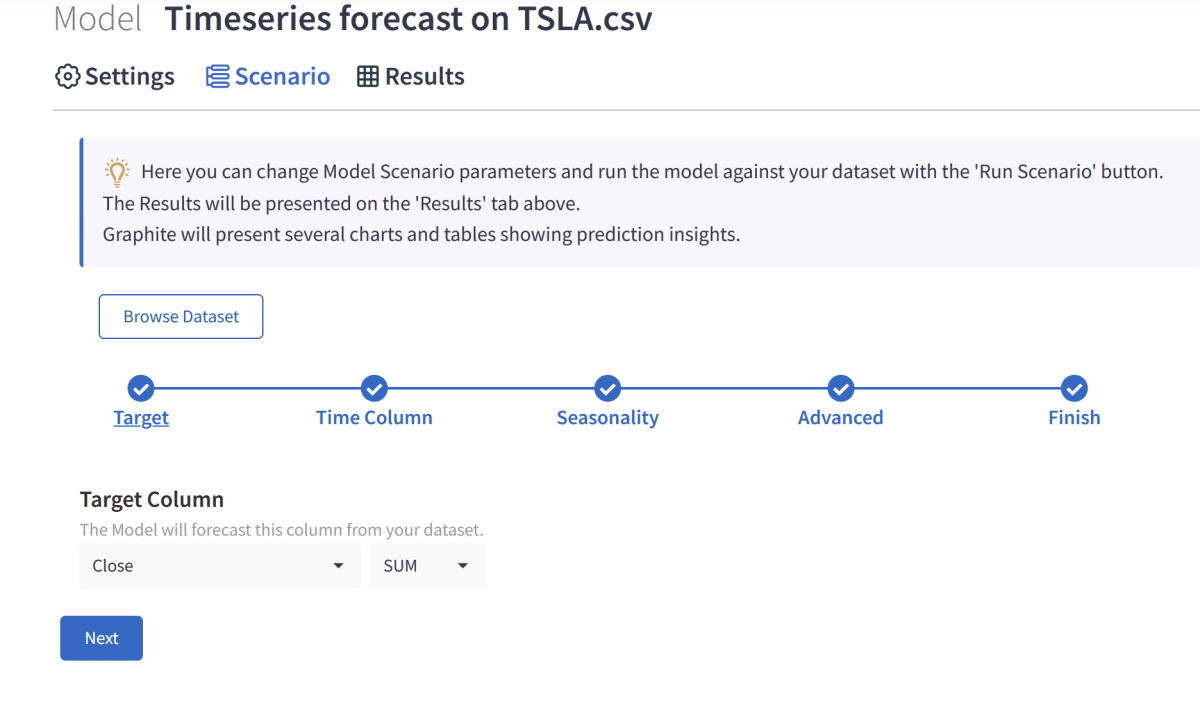
We will use the CLOSE column for our prediction – it is our target column.
It is the last trading price recorded when the market closed on the day.
Time series forecast
Predicting stock prices and building a stock price forecast is a great use case of machine learning both for financial time series analysis. You can read more about the time series forecast here. Time series forecasting looks at recorded data over time to forecast or predict what might happen in the next time period. Time series forecasting operates under the assumption that future trends will be similar to historical trends. A stock forecast can be built using a time series forecast.Reminder: don’t use the results here as financial advice. This exercise should only be used to demonstrate the power of no-code machine learning to predict time-series datasets. Machine learning models can only “learn” what we feed them – and in this case, that is a historical pattern.
Time series forecast model in Graphite Note
Now that we have our dataset ready, we can create a no-code machine learning model in Graphite Note. We chose the Time Series Forecast model:
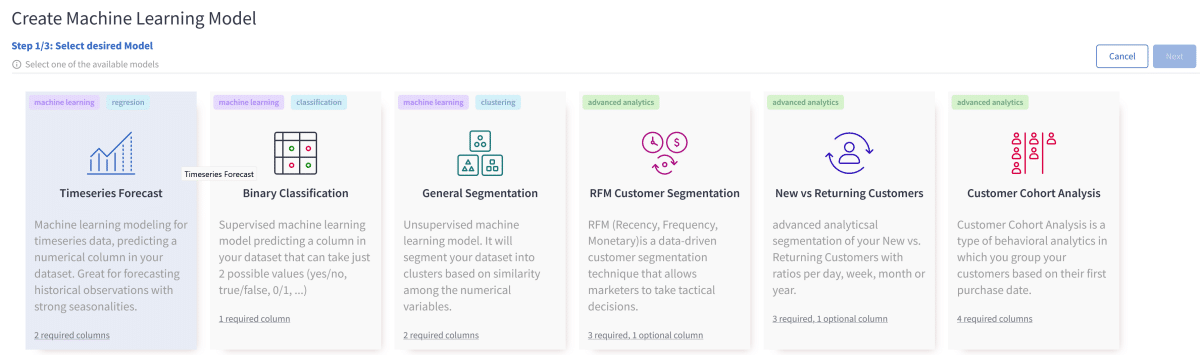
In Graphite, to build a time series model, you need only 2 columns
- a target column (what are we predicting?)
- a date column (with dates, weeks, months, …)
And that is all.
In the next few mouse clicks, we define a model scenario.
Selecting Target column from our dataset:
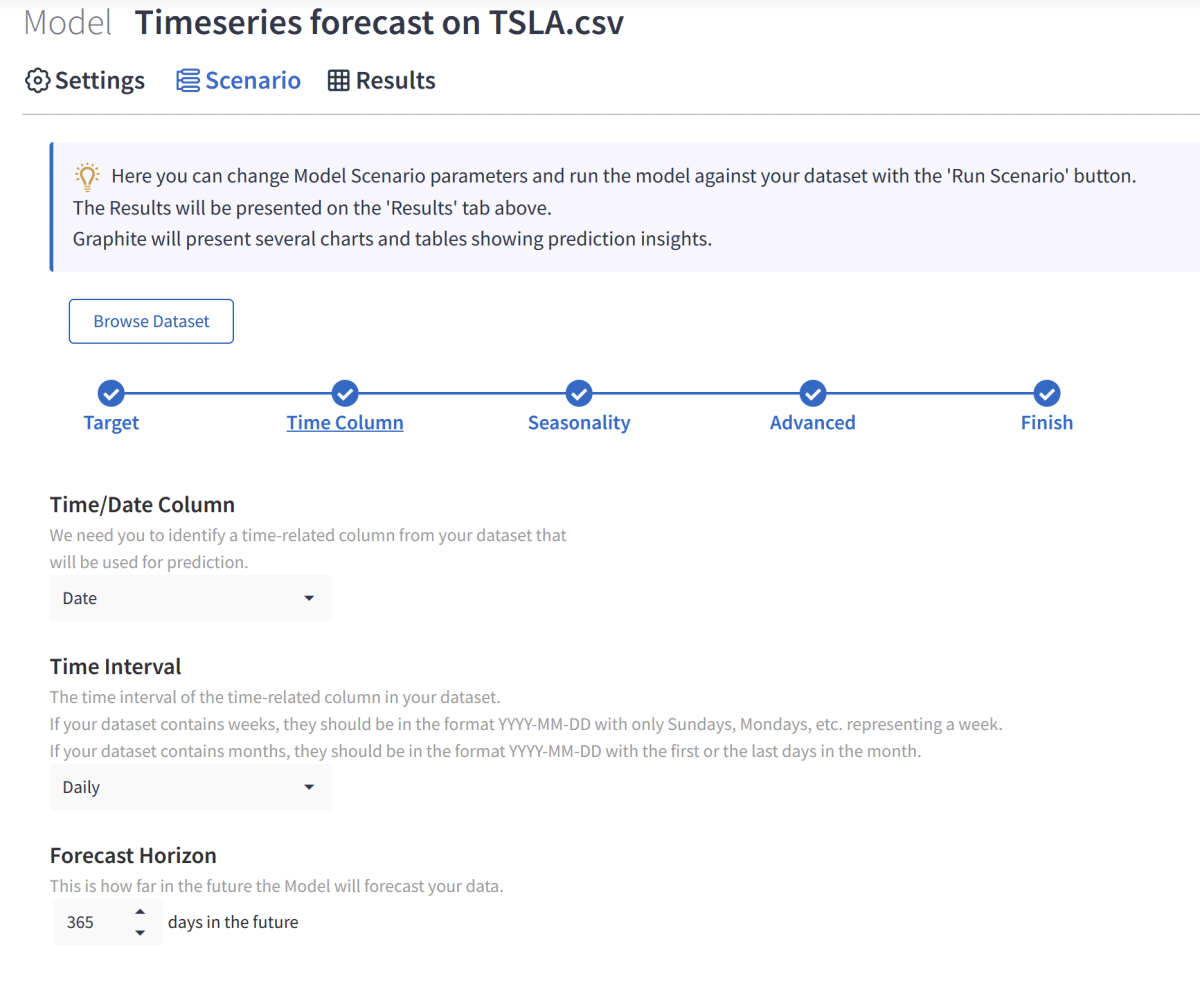
Selecting date column from the dataset, with the desired forecast horizon of 365 days:
Run the machine learning model for a Tesla stock price prediction
Graphite Note will take a sample of 80% of our data and train several machine learning models. Then, Graphite Note will test those models on the remaining 20% and calculate relevant model scores. The details about the final best model fit, seasonality, trends, results, and predictions will be available on the Results tab.
After a few seconds, we have our results. On the model fit tab, Graphite Note will show historical data in blue, and predicted data in yellow.We have our prediction for the next 365 days immediately ready at our disposal. For example, Graphite predicted a price of 353.64 on 2022-12-24.
Tesla stock price prediction
We can now examine further analysis to understand the model and model fit better. A clear changepoint in global trend was detected in the data during November 2021. We also see the details about minimum and maximum data points:
general trend in data
It is always interesting to see what seasonality was detected in historical data. This kind of information can be very valuable in eCommerce and Retail as well, for example.
In our case, there are 2 seasonal patterns detected – weekly and yearly seasonality.
Based on training the model on the historical data of TSLA stock prices, it seems that the highest closing prices occur on Saturdays and Sundays, and the lowest is on Fridays. This clearly reflects when the strong buy pull and strong sell pull is in full effect.
weekly seasonality
Moreover, the price seems to be highest in January, and lowest in June – regarding yearly seasonality detected.
But bear in mind that we had only less than three years worth of data – so that is not a piece of very reliable information. If we trained the model on 5, 6 years of data – then yearly seasonality will have a much bigger weight.
yearly seasonality
Graphite Note also tried to detect if USA holidays had any correlation with prices going up or down.
It is potentially exciting information that on 11 Nov (Veteran’s day), it detected the most significant negative impact on the price. The last day of the year has the most important positive effects for the price. This technical analysis helped us understand the electric vehicle makers’ revenue growth.
holiday effects
Conclusion
I hope that this helped you understand how easy it is to train models in a no-code machine learning software like Graphite Note. With just a few mouse clicks, we were able to predict the stock price, and analyze seasonality, trends, and patterns in data.
You can explore all other Models here. Feel free to train your own machine learning model on any dataset with the same ease, or schedule a demo if you need any help or have any questions.
Hope you enjoyed it!