What is Time Series Forecasting?
What is time series forecasting?
Time series forecasting is the process of analyzing time series data using statistical models to make predictions and inform strategic decision-making.
It’s a predictive analytics technique used across many fields to predict events based on patterns and historical data – and has been a staple of data analysis for most of the modern era.
What is time series data?
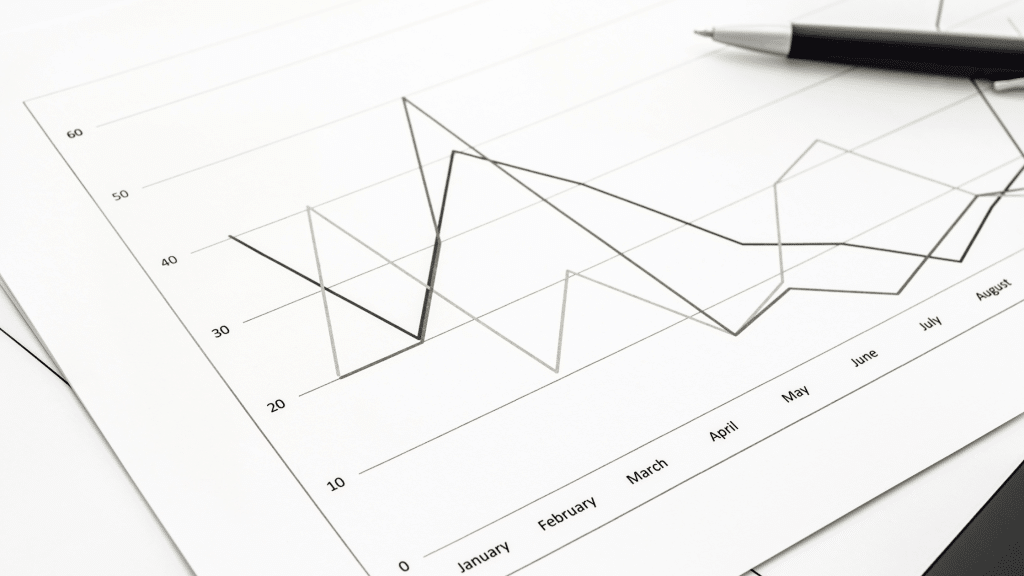
When data is recorded at regular time intervals, it is called time-series data. Time-series data is data that is collected at different points in time. Time series data is different to cross-sectional data, which focuses on specific points of time.
Time series data can take on many forms. You may recognize some of them. Examples of time series data include:
- Weather reports.
- Population records.
- Birth rates. Gross Domestic Product (GDP).
- Consumer Price Index (CPI).
- S&P 500 Index.
- Unemployment rates.
Times series forecasting
Time series forecasting assesses recorded data over time to forecast or predict what might happen in the next time period. A time series analysis operates on the assumption that future trends will be similar to historical trends. Time series forecasting is a predictive analytics technique. Time series forecasting is used across many fields. Time series forecasting has been a staple of data analysis for most of the modern era.
What is time series forecasting used for?
Time series forecasting is often used to predict customer demand. This makes a time series forecasting method highly useful in eCommerce. Time series analysis has various use cases:
- Mathematical finance.
- Stock market analysis.
- Electricity consumption prediction.
- Economic forecasting.
- Inventory studies.
- Budget analysis.
- Yield projection.
- Sales forecasting.
- Revenue predictions.
- Sales predictions.
- Resource demands.
You can use a time series model for a range of applications. Accurate forecasts are highly valuable planning tools. Time series forecasting can be used to predict crypto market performance. Time series forecasting can help you allocate resources more efficiently and make smarter business decisions.

The basics of time series forecasting
1. Identify a forecasting method.
There are two primary types of forecasting methods:
Quantitative forecasting methods
A quantitative forecasting method uses historical data from time series or correlation information. There are four different approaches you can use in a quantitative forecasting method:
- Naive approach: The naive approach entails considering trends and assuming that these will hold true for the next time period
- Trend projection: In trend projection, you look at the trajectory of what is happening right now, and use that to forecast what will happen in the next time period.
- Moving average: With a simple moving average, you take an average of the past selected time periods. You then assume that the average is the estimate for the next time period.
- Exponential smoothing: In simple exponential smoothing, you take a weighted average approach. You will attribute more weight to relevant time periods, in different ways, depending on your forecast.
Qualitative forecasting methods
A qualitative forecasting method considers opinions from experts, decision-makers, or customers. There are four different approaches you can use in a qualitative forecasting method:
- Delphi method: With the Delphi method, you ask a trusted advisor or consumer about their thoughts on what’s about to happen, based on consumer behavior. You then compile this data to inform decision making.
- Executive opinion: Executive opinion is exactly as its name suggests. With executive opinion, you ask a group of executives to give their input into what they believe is going to happen in the next time period. This is often based on their past observations.
- Consumer surveys: With consumer surveys, you ask consumers about their potential intended behavior. This may include asking them about a product, or the likelihood of them buying it. You then compile this data to project potential customer demand.
- Sales force estimates: In sales force estimates, you ask salespeople about their forecasting estimates, and use that data to compile your projections. Sales force estimates are also often based on past observations.
2. Remember that historical data can be limiting.
No data analysis method is perfect. Time series forecasting can have its weaknesses. Time series forecasting relies on historical data. If your data is outdated or inaccurate, this will affect your projections. You may also have generalized data, or limited data. Time series forecasting can also be affected by your prediction interval. A prediction interval is a range of values that captures your forecasted point estimate with a certain level of confidence. Your prediction interval acknowledges that there is a level of uncertainty in your forecasts. You also need to account for series decomposition, and other factors. You may need to consider how to use consistent intervals, or if that doesn’t work for you. You’ll need to decide on your regular intervals too. Your input data may not be accurate. There are many important factors to consider when using time series forecasting methods. You may have different data types or varied training data. You may only have certain sets of data available to you. All of these are important factors in considering the limitations of your historic data. Be sure to account for, and cater for, your data limitations.
How can I use time series forecasting for my business?
Revenue Forecasts
Time series forecasting is useful for creating revenue forecasts. Time series forecasting uses historical data. Time series forecasting highlights where you can focus or improve on your business. Time series forecasting helps you plan for better financial outcomes and growth. For this use case, you can make more informed business decisions, using your historic data.
Planning
Time series forecasting models help you plan and strategize. Time series forecasting helps you understand cause-and-effect that’s backed up by historical data. Time series forecasting enables you to assess what did, or did not work, in the past. This use case enables you to create a robust business plan for the next time period.
Demand planning
Anticipating customer demand is important for your business. Time series forecasting can guide your demand planning. Basing your projections on past data, you can assess future customer demand. That enables you to manage stock levels, maximize your revenue, and other operations. You can also use time series forecasting to assess the viability of releasing a new product. This use case can also help you to target new customers.
Time series forecasting models
These are some of the time series forecasting models you can use.
- Exponential smoothing: Exponential smoothing uses a weighted approach of past data. This weighting decreases over time. More recent data, therefore, are weighted more highly. Exponential smoothing usually gives you reliable forecasts for a wide range of time.
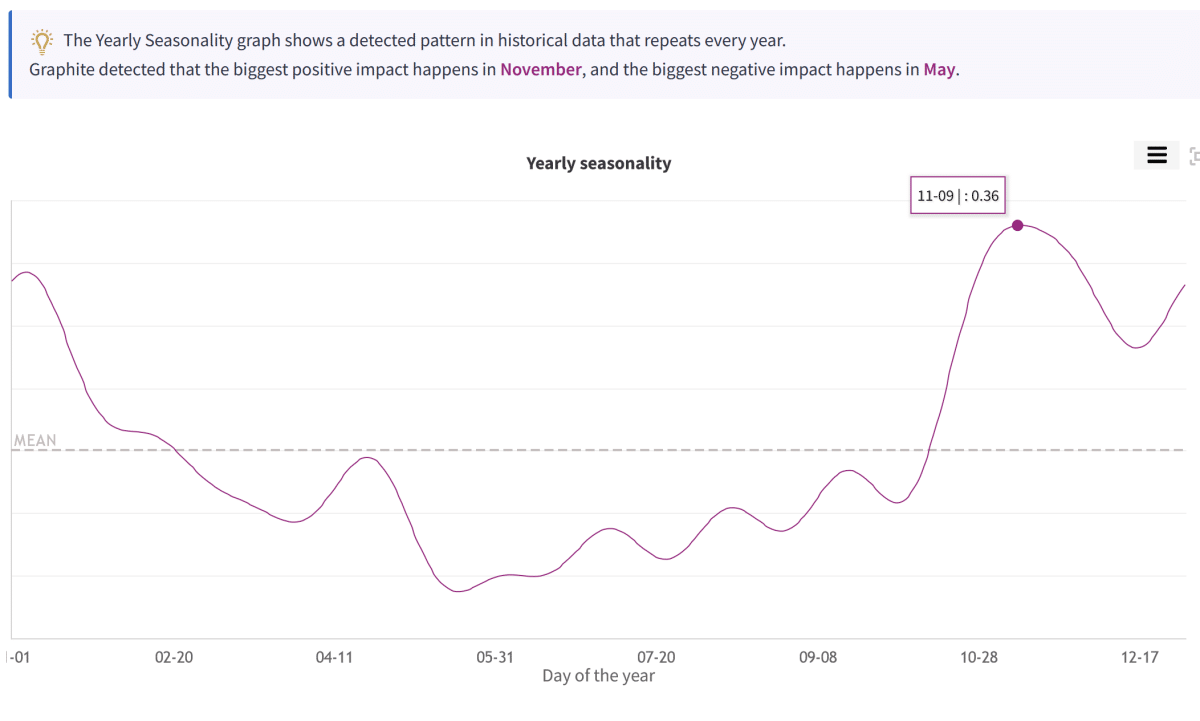
- Dynamic linear models (DLMs): Dynamic linear models treat your data parameters as non-static. As the parameters vary over time, DLMs may help to improve forecast accuracy where you need to consider historical variations. Dynamic linear models are often used to account for seasonal changes, economic changes, competition, or other factors.
- Prophet: Prophet is an open-source software created by Facebook’s Core Data Science team. Prophet is a time forecasting software that helps you forecast using an additive model. Non-linear trends are fit with yearly, weekly, and daily seasonality, and adding the effects of holidays.
- ARIMA: ARIMA stands for Autoregressive Integrated Moving Average Model. ARIMA is used for non-stationary data that has a trend component. An Autoregressive Integrated Moving Average Model is widely used in addition to exponential smoothing. ARIMA can handle data with a trend. ARIMA cannot, however, handle data that has a seasonal component. ARIMA time series models rely on past values, while regression models look at external factors. A regressive model differs from an ARIMA model.
- SARIMA: SARIMA is also known as Seasonal ARIMA. SARIMA stands for Seasonal Auto Regressive Integrated Moving Average Model. As an extension of ARIMA, Seasonal ARIMA can account for seasonal variation.
Conclusion
Time series forecasting models can be helpful for a wide range of businesses. Time series forecasting models can help you optimize your business for growth. Using historic data to predict future data over a set period can help you build a better business.