
In consumer goods, “innovation” often means slapping a new flavor on an existing product and calling it strategy. Mango Coke. Pumpkin spice everything. A “limited edition” bar that will be back every quarter until the end of time.
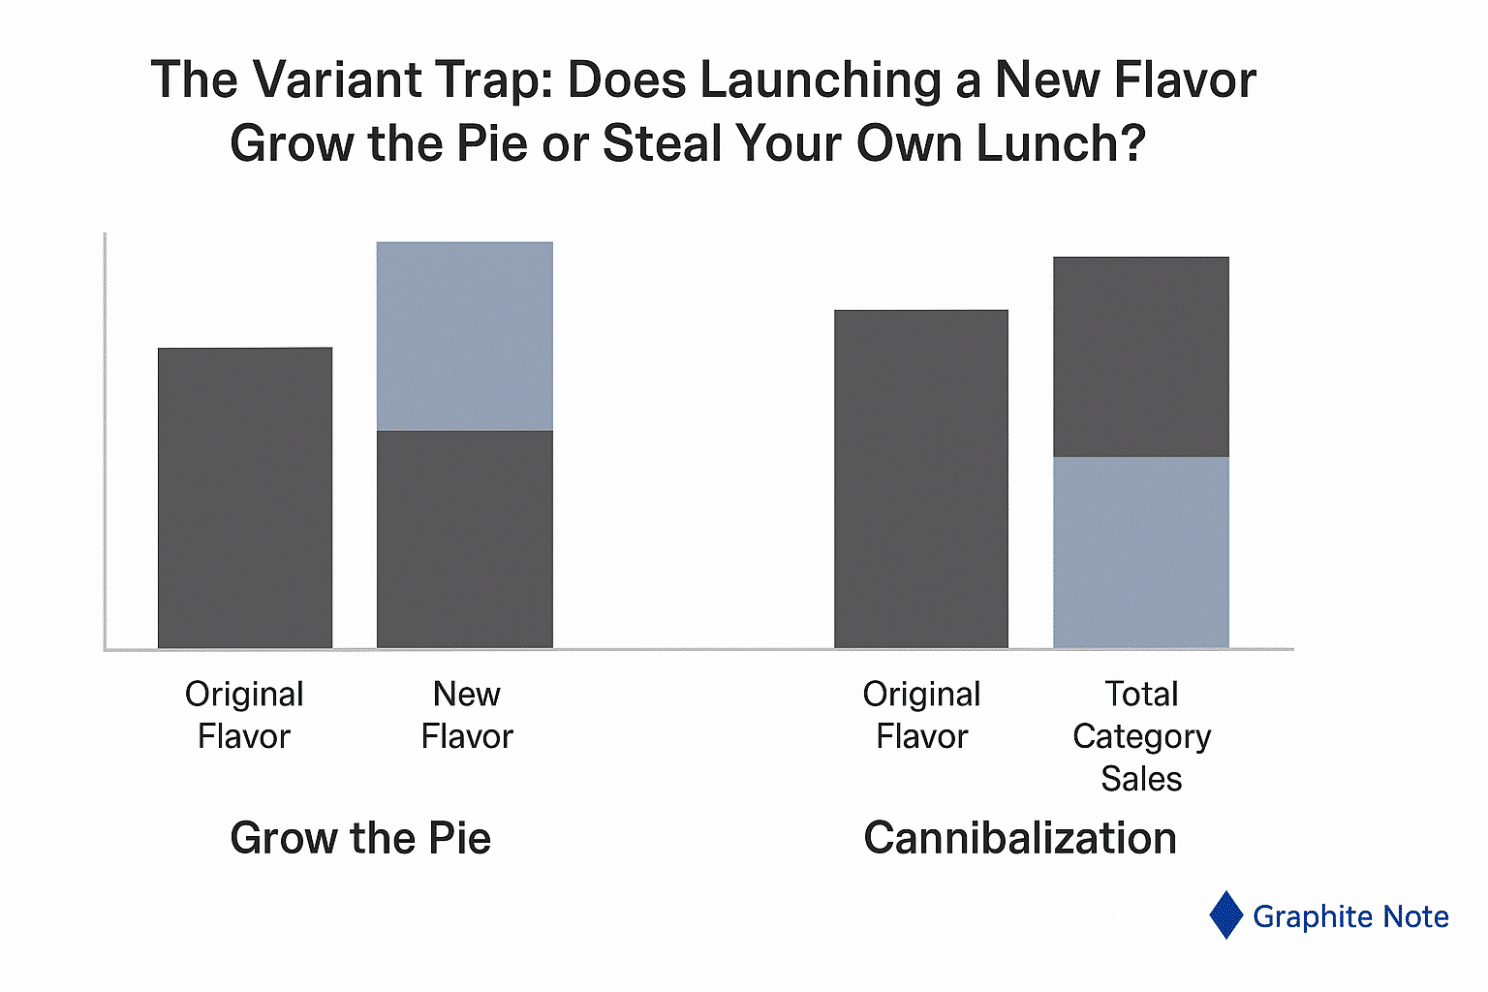
The story is always the same in the pitch deck: this launch will grow the category, bring in new customers, and lift the brand. The reality is more sobering. New variants can be a polite form of cannibalism. They steal sales from your existing SKUs while adding complexity, operational cost, and shelf clutter.
The question isn’t whether a variant will sell. It will — at least for a few weeks. The question is whether it creates net new category sales or just reshuffles your existing demand. And the only way to know that is to measure the causal effect of the variant, adjusted for the messy background of your market.
This is a case study on doing exactly that: one offer (the launch of a new variant) measured against one target (total category sales), with five background conditions adjusted so we compare like with like. The result? Proof that the variant strategy either expands the pie or simply eats your own lunch.
Problem and challenge
Launching a new variant is not inherently bad. It can be the spark that re-energizes a category. But without measurement, you’re flying blind.
The risks are predictable:
- Cannibalization: sales shift from old SKUs to the new variant. Net category revenue barely moves or declines.
- Complexity cost: new supply chain requirements, more shelf SKUs, and higher operational complexity.
- Retailer fatigue: pushing new SKUs too often erodes retailer trust and reduces support for future launches.
The challenge: isolate the incremental effect of a variant on total category sales. This means comparing scenarios with the variant versus without, for customers and stores with similar underlying conditions.
Dataset columns used in the analysis
For each store-week observation, we included:
- store_id — unique store identifier
- week_start — week start date for time alignment
- category_sales_value — total sales value for the category that week
- variant_sales_value — sales value for the new variant that week (zero if not stocked)
- store_traffic — average weekly footfall from in-store counters
- historical_category_trend — rolling 12-week average growth rate before launch
- promo_count_category — number of active category promotions that week
- competitor_activity_flag — indicator for major competitor launch/promo that week
- shelf_space_share — proportion of category shelf space allocated to our brand
- launch_flag — indicator for weeks after variant introduction in a store
These columns allowed us to compare launch and non-launch stores on a like-for-like basis, control for external factors, and isolate the variant’s true effect on total category sales.
The setup in business language
Target we care about: total category sales (value), over a defined 12-week launch window.
Offer we’re testing: the launch of a new flavor or variant in an existing product category, supported by normal promotional activity.
The background conditions we adjust for so we compare like with like:
- Store traffic volume — stores with higher baseline footfall naturally sell more; we need to compare stores with similar traffic.
- Historical category sales trend — if a store’s category sales were already rising or falling pre-launch, that trend can distort impact.
- Promotional intensity during the period — number of active promotions in the category; we must separate the variant effect from promo noise.
- Competitor activity — competitor launches or promotions in the same period can steal or boost sales independent of the variant.
- Shelf space allocation — proportion of total shelf space dedicated to our category; more space often equals more sales regardless of variant.
Data window: 12 months pre-launch for baseline behavior, plus 12 weeks post-launch for measurement.
Scope: 500 retail stores, half receiving the variant (treatment) and half not (control), matched on the five background conditions.
Method without the mystique
We are not looking for correlation. We are looking for what changed because of the variant — and only because of the variant — after accounting for store differences, competitor behavior, and promotion patterns.
We compare like for like: stores that got the variant and those that didn’t, matched on background conditions. We check pre-launch sales trends to ensure both groups moved in parallel before launch. If they didn’t, we adjust.
We measure the difference in total category sales between treatment and control during the launch window. That difference, after adjustment, is the causal effect.
We then break this down by store segment to see where the variant adds value and where it cannibalizes.
What we found
At the total chain level, the variant’s effect was mixed. Some stores saw a meaningful lift in category sales. Others saw the new variant eat into existing SKUs with no net growth.
High-lift stores (about 35% of total):
- Sales increase in total category value of 8–12% during launch window.
- Drivers: high footfall, mid-range historical category growth, and strong baseline performance for the core SKUs.
- Likely mechanism: variant attracted new trial without displacing core SKU buyers.
Neutral stores (about 45%):
- Sales change between −1% and +2%.
- Drivers: high overlap in purchase patterns between variant and core SKUs; promotional saturation.
- Likely mechanism: variant sales almost entirely substituted existing SKU purchases.
Negative stores (about 20%):
- Sales decline in category value of 3–6%.
- Drivers: low shelf space, competitor launch overlap, weak pre-launch category trend.
- Likely mechanism: variant disrupted core SKU momentum without attracting net new customers.
Decision Intelligence outputs
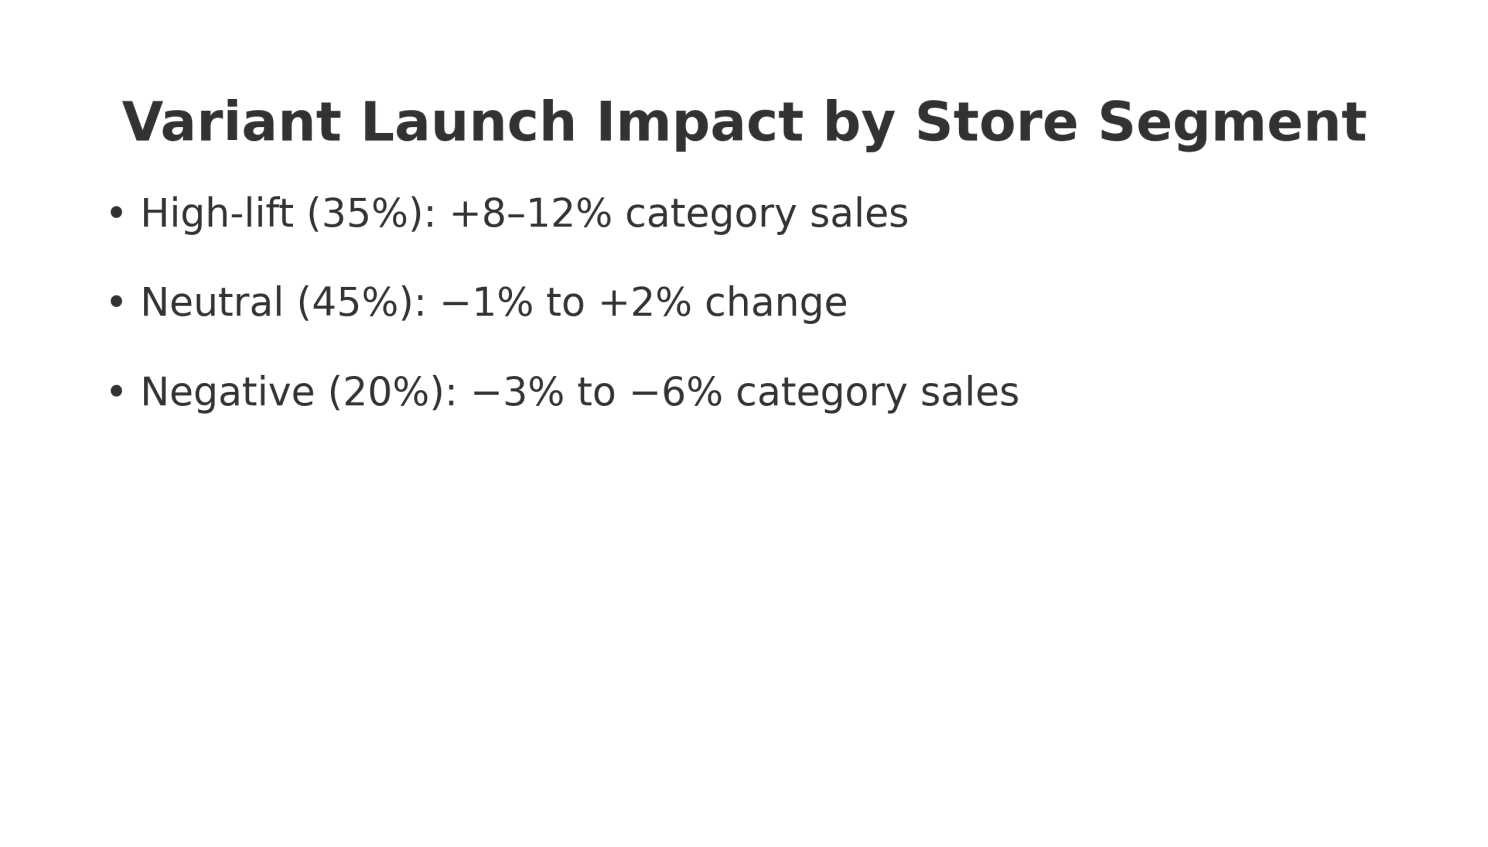
Segment definitions and impact:
- High-lift: about 35% of stores. Total category sales up 8–12%.
- Neutral: about 45% of stores. Change between −1% and +2%.
- Negative: about 20% of stores. Category sales down 3–6%.
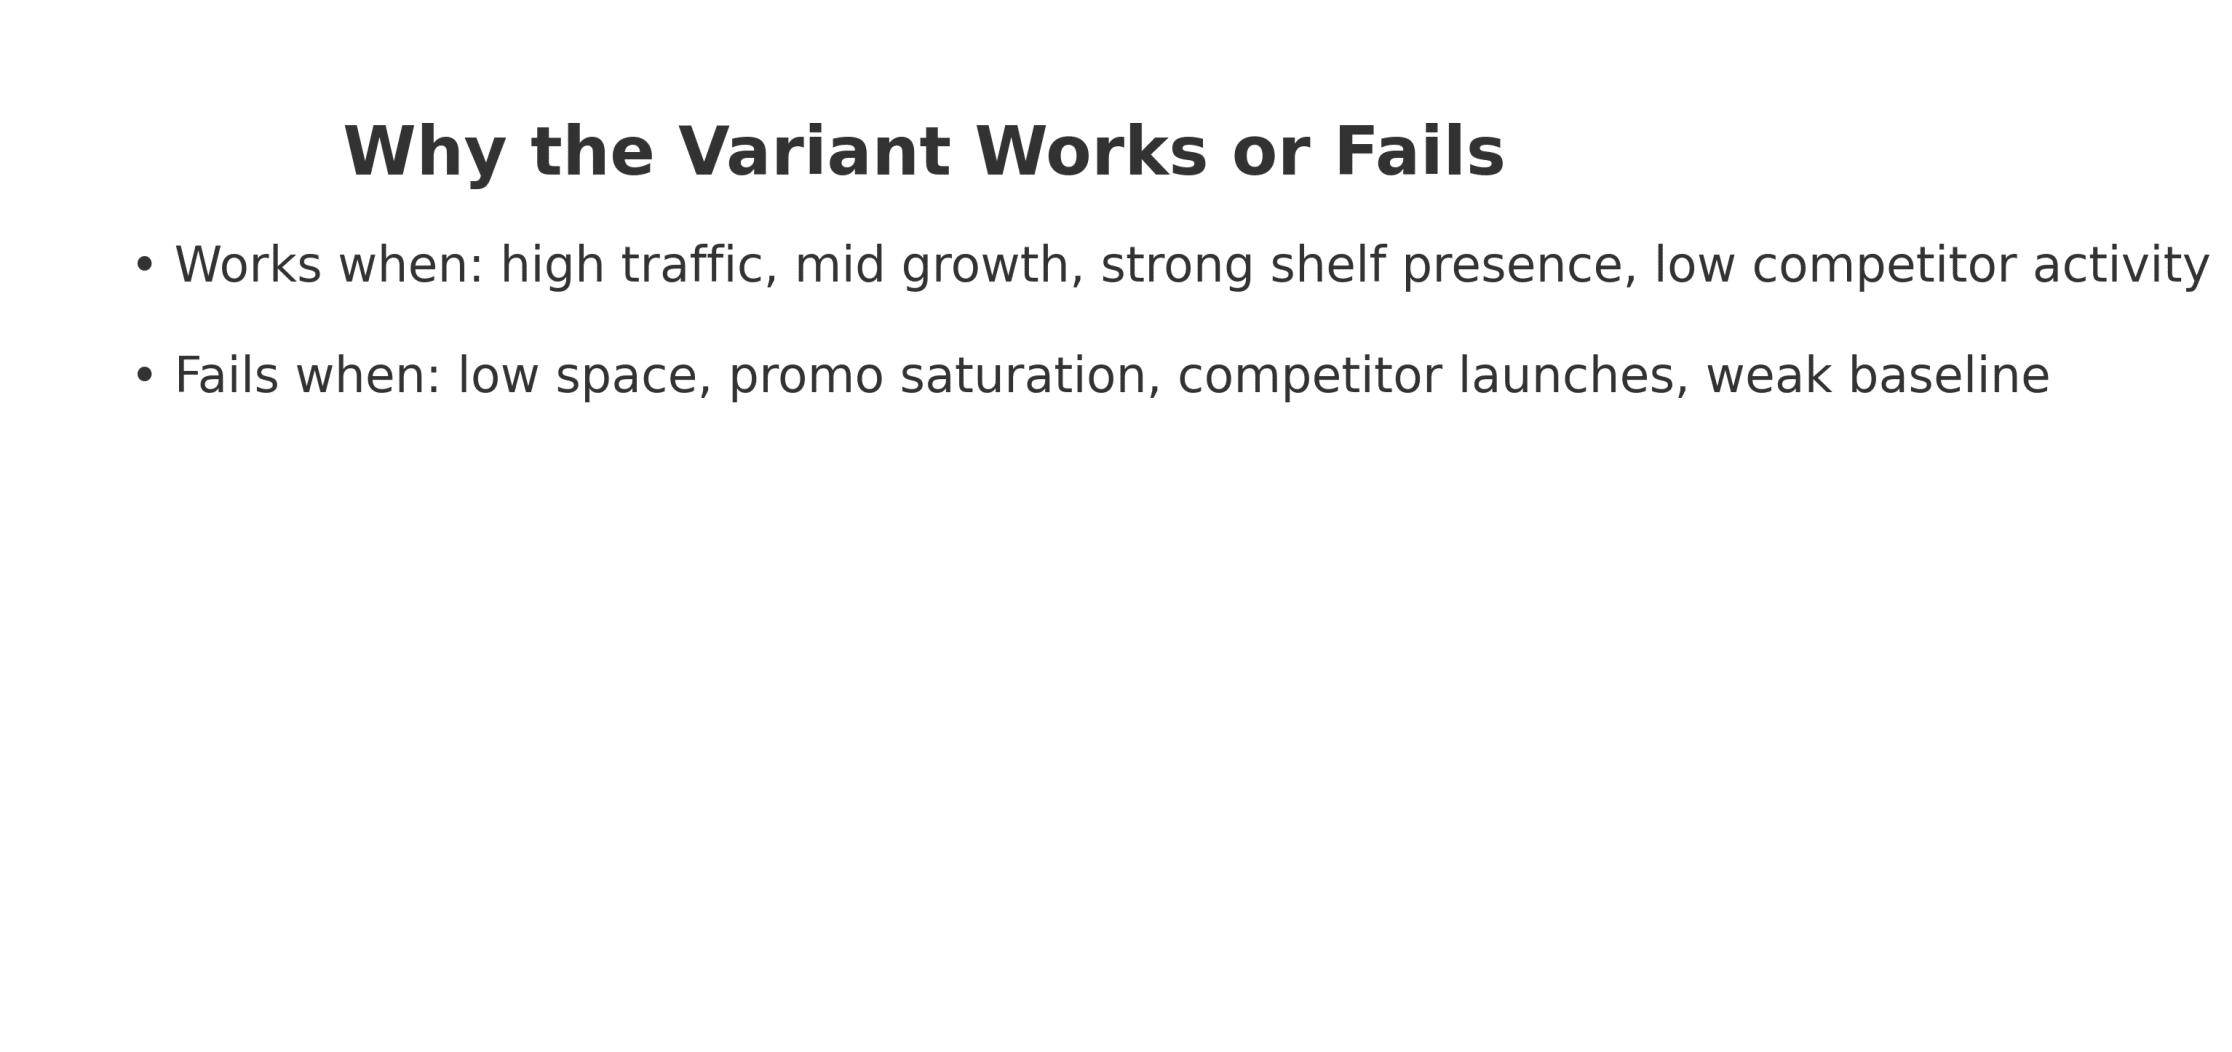
Why the variant worked in high-lift stores:
- Strong store traffic to convert curious trial into real sales.
- Mid-level historical category growth — room to grow without saturation.
- Adequate shelf space to accommodate new SKU without displacing core lines.
- Competitor activity low or absent in launch window.
- Balanced promotional environment so the variant stood out.
Why it failed elsewhere:
- Too little shelf space, forcing delistings of core SKUs.
- Competitor launches stealing attention and spend.
- Overlapping promotions drowning the variant in noise.
- Weak baseline category performance that no variant could fix.
Financial impact in plain language
The variant launch delivered a net positive effect chain-wide, but only because the lift in high-performing stores outweighed the drag in others.
If we had launched only in high-lift stores, the net incremental category sales would have been 2.4x higher and the complexity cost 40% lower.
The key takeaway: in consumer goods, launch decisions must be segmented. The “chain-wide launch” is often an expensive habit masquerading as confidence.
The prescription
Who should get the variant next time:
- Stores with high or medium footfall.
- At least mid-level historical growth in the category.
- Shelf space allocation of 20%+ to our brand.
- No overlapping major competitor launch in the same month.
- Promotional load balanced — no more than 2 other major promos in the category that week.
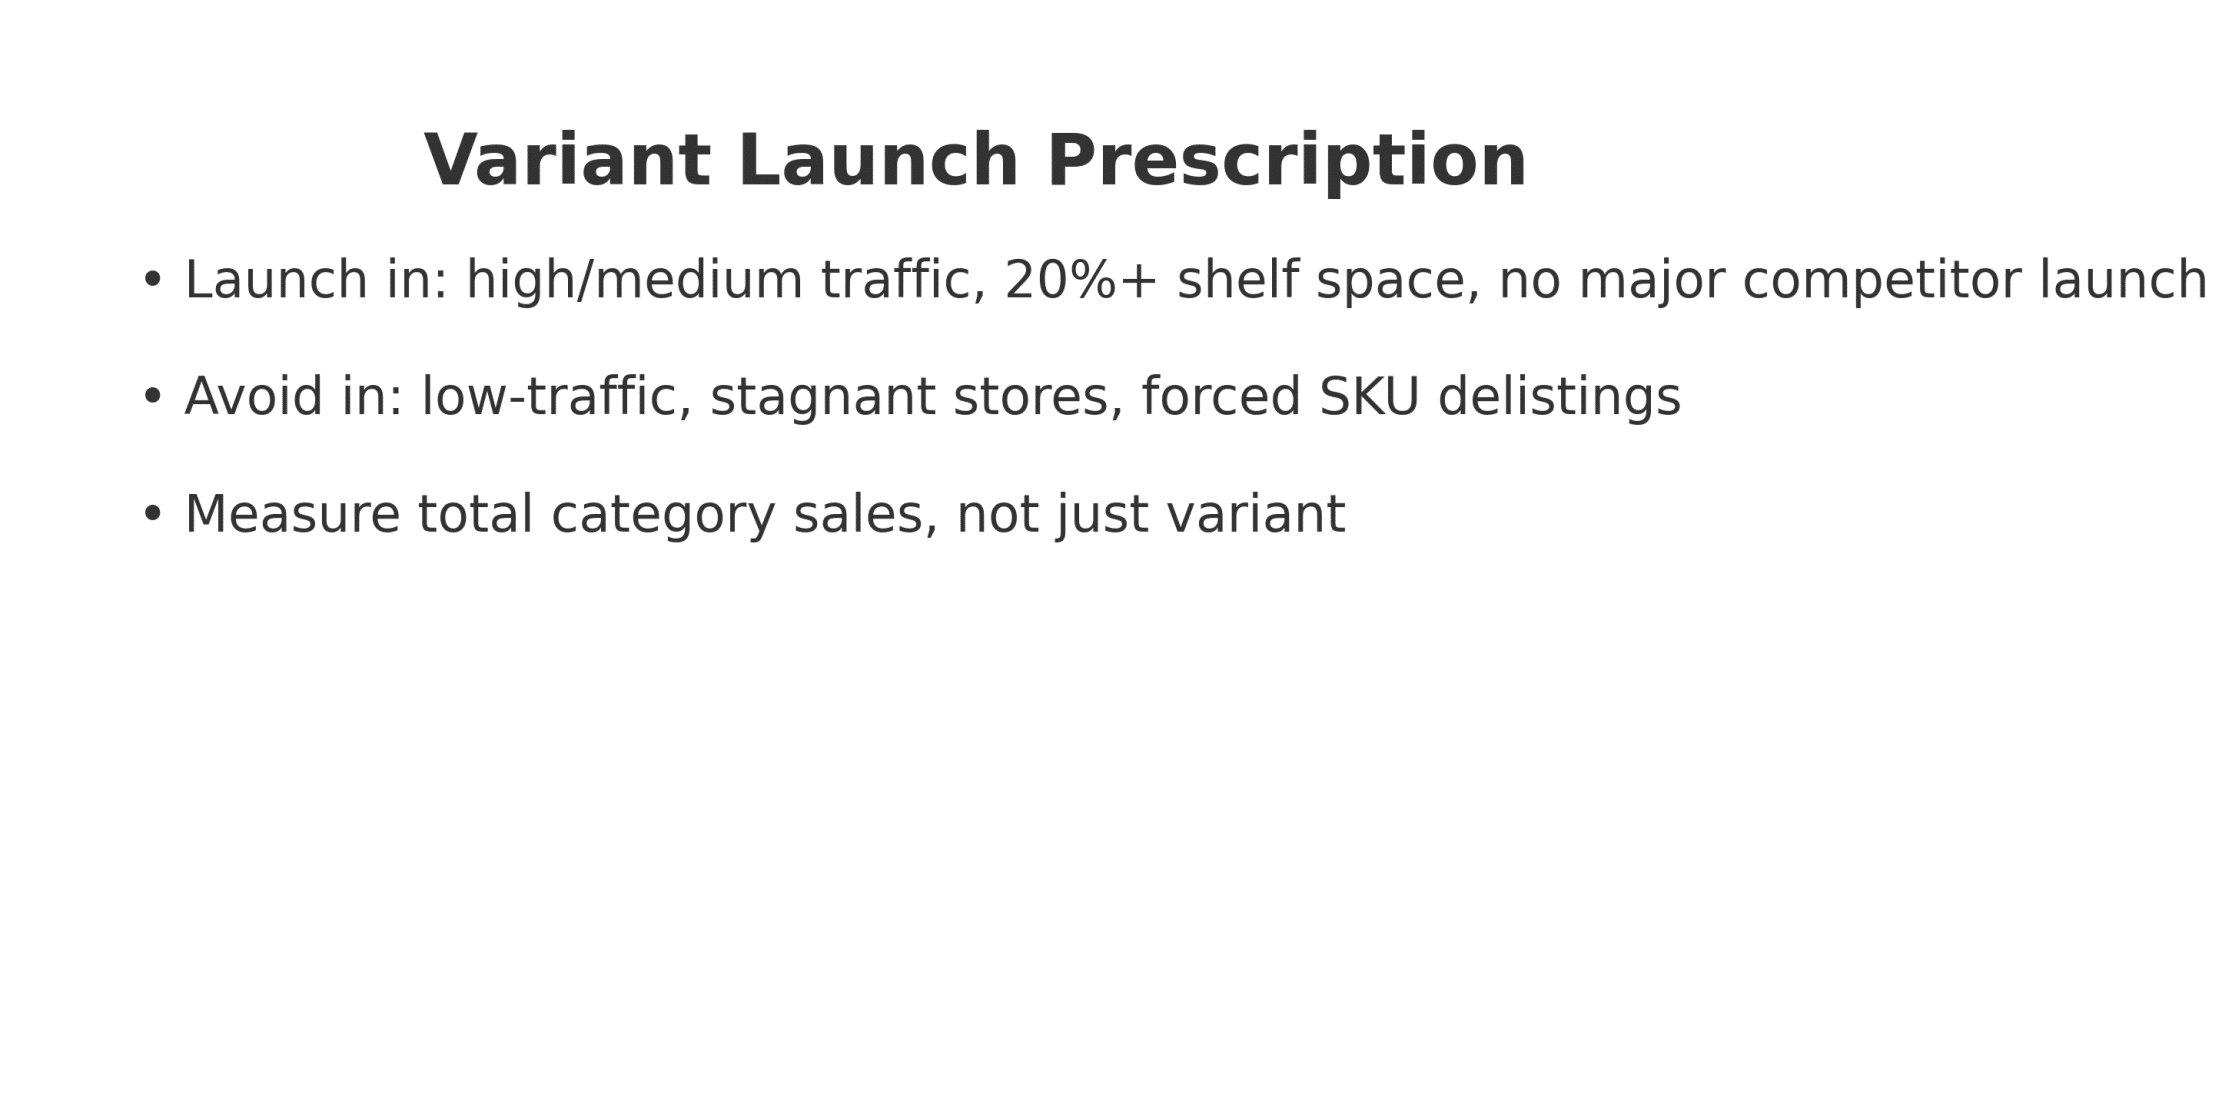
Who should not get it:
- Low-traffic stores with stagnant category performance.
- Stores where the only way to fit the variant is to remove a high-performing core SKU.
- Retailers with a history of shortlisting new variants quickly due to low rotation.
How to measure impact in-market:
- Compare total category value, not just variant sales.
- Track pre/post launch share of shelf and competitor activity.
- Look for repeat purchase rates of the variant after the first 4 weeks — if it doesn’t stick, the lift won’t last.
Why this prescription is trustworthy
We validated it on holdout stores — those not included in the original matching — and saw the same pattern. We tested for pre-trend similarity to ensure launch and non-launch stores were moving together before the variant. We ran seasonal checks to confirm that the effect wasn’t just a holiday bump in disguise. And we reviewed the prescription with the field sales team, who confirmed that the “high-lift” stores matched their own experience of which doors actually move volume.
When the model’s prescription matches the gut feel of people who live in the category every day, you’ve got something worth acting on.
What this means for your brand
Variants are not a free lunch. They can grow the pie — but only under the right conditions. If you don’t check those conditions, you’re playing SKU roulette.
The work is in separating “new and exciting” from “new and self-defeating.” That requires a disciplined measurement of total category impact, not just shiny launch-week sales.
The next time someone in the room says, “Let’s just launch everywhere,” you’ll have the numbers to show them why that’s an expensive superstition.
CTA: Want the full variant launch decision template we use with consumer goods brands? Book a demo https://graphite-note.com/book-demo/ .
#DecisionIntelligence #CausalAnalytics #ConsumerGoods #ProductLaunch #CategoryGrowth