Customer cohort analysis is a helpful e-commerce tool. Your cohort analysis report can help you optimize your marketing and promotional efforts. Your business will be better equipped to focus on customer experience and retention. Customer cohort analysis classifies your customers into groups. The user groups are based on a common trait. Cohort analysis then tracks their behavior over a particular time frame. Behavioral cohort analysis looks at the frequency with which your customers shop in your store, how long they stay, and how much they spend. You can group your customers according to the type of campaign that converted them. You can create a customer cohort based on the first product they ever bought from you. You can also create a customer cohort on conversion time.
What is a customer cohort analysis and what is its role in eCommerce?
Customers are grouped in alignment with their purchasing behaviors. A customer cohort analysis can be mapped out into a cohort analysis chart. You can also conduct customer cohort retention analysis, customer acquisition cohort analysis, and assess various types of customer cohorts. You can also analyze your customer churn rate, and create cohort reports to share with your stakeholders. Cohort analysis tools help you to create an insightful cohort report which can empower your decision-making. Using customer data and cohort data, you create customer segments, which are also known as customer groups.
In e-commerce, customer cohorts are customer groups. They are grouped based on a commonly shared characteristic over a period of time.
Here are some specific examples:
● Customers acquired via Instagram ads.
● Customers who purchased after a free trial.
● Customers who returned over the past three months.
People can be grouped based on similar behavior exhibited over a specific amount of time. Customer cohort analysis looks at the ‘customer’ not as a single entity, but as a diverse group with varied behaviors. Once you’ve pinpointed significant patterns and trends in customer behavior, you can create marketing campaigns targeting these specific groups. This is often a better approach than launching a singular marketing campaign targeted towards a very broad audience. You can use customer cohort analysis to better understand your customer base. Customer cohort analysis helps you know how a customer experiences your store. Customer cohort analysis helps you pin down your customer acquisition cost.
Types of Cohorts
- Acquisition Cohorts
Acquisition cohorts are groups divided by when they signed up for your product. For example, you can break down cohorts according to their sign-up date on your e-commerce app. You’ll then be able to measure retention by how long they continue to use your app since their sign-up date. An acquisition cohort chart will help you ascertain your customer acquisition cost.
- Retention Cohorts
This helps you understand the percentage of users retained on your app until a certain, defined day. User retention can also be measured by how often and how regularly or rarely they come back to use your app or browse your online store. Customer retention cohort charts outline your customer retention rate for a particular cohort. Your cohort table can spotlight your customer success ratio too, as you get to grips with customer behavioral analytics.
- Behavioral Cohorts
These are groups divided based on the behaviors they exhibit within your app over a certain period of time. ‘Behaviors’ can refer to any number of actions performed within an app or site. This could be sharing a photo, posting something, or liking something. You can then look at how long these cohorts are retained after performing such actions.
How Does Customer Cohort Analysis Help E-Commerce Businesses?
Predicts Future Customer Behavior
Customer cohort analysis is very helpful in terms of predicting customer behavior. You have specific data (like your Google Analytics). Using your data enables you to target potential customers with localized efforts (ads, promos). This helps you convert leads to customers.
These insights allow you to understand customer behavior and anticipate their needs. This increases your chances of customer success and customer retention. Cohort analysis can also help you conduct churn analysis. Churn analysis helps you understand the specific cohort who churn, or leave your business. As you group users into cohorts, you become better acquainted with how people interact with your business. You can gain deeper insight into how to attract new customers, or predict how your active users will behave over a specific time frame. Analyzing user groups, you can look into user engagement, user behavior, and different cohorts. You gain actionable insights that highlight your next business move. Cohort analysis also helps you spot any concerns related to your customer onboarding process. Cohort analysis tells you how new users find your business too.
Increases/Improves Customer Retention
Retention is king. If you lose customers, you lose sales. Your retention metrics will tell you so much!
Customer cohort analysis gives you valuable insights that enable you to keep existing customers. and maximize revenue. Studies have shown that returning customers spend at least 67% more than new customers – that’s a lot. It costs significantly less to keep existing customers happy. It costs far more to keep on launching campaigns to attract new customers.
Helps to Understand Your Best Products and in Turn Create Offers
Customer Cohort analysis can give you insights into what your ‘best sellers’ are. Cohorts are often grouped according to ‘first product ordered.’ Using this metric, you can see which of your products stand out the most to new customers.
You might also find which products customers buy often and repeatedly. You will be able to spot your loyal customers. You can then highlight these products or create offers. These will ultimately improve customer engagement and retention.
Helps to Customize Your Marketing Strategies
Customer Cohort analysis is a powerful tool that will help you customize your marketing strategies based on what works and what doesn’t. Insights from cohort analysis will let you know how exactly you need to adjust your marketing activities and what you need to focus on.
Cohort analysis will help you determine whether you need to launch a customer loyalty program. Insights from cohort analysis will allow you to find out if your existing clients are satisfied even without a loyalty program.
In this case, you can just continue your best practices and may not urgently need to launch a loyalty program.
Metrics for Customer Cohort Analysis That You Need to Know
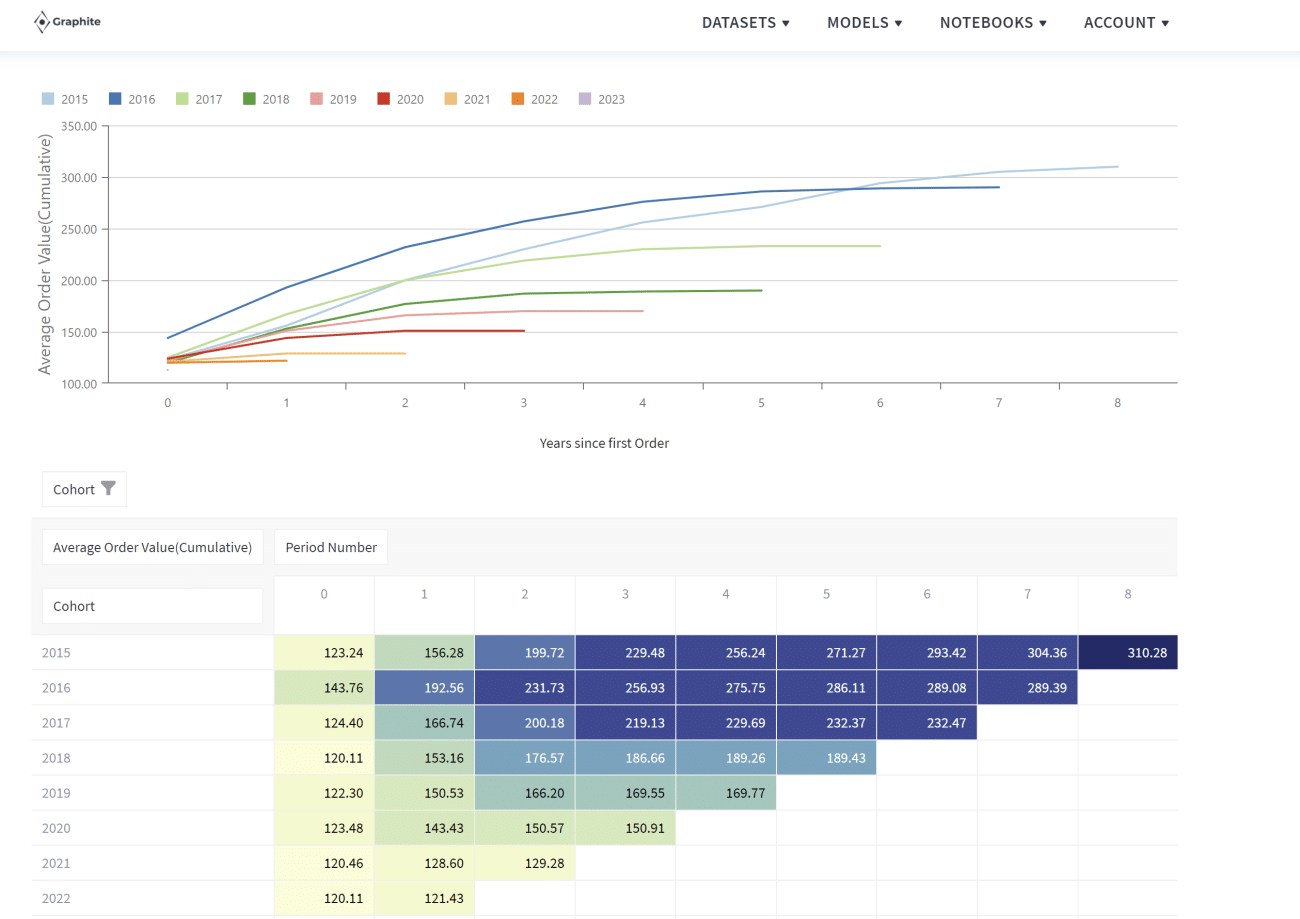
Average Order Value
Average Order Value (AOV) measures the average total of every order placed with a merchant over a defined period of time. This is one of the most important metrics that merchants should be aware of. Your AOV drives important business decisions. Your AOV helps you measure and pinpoint pricing, advertising budget, and store display. such as advertising spend, store layout, and product pricing.
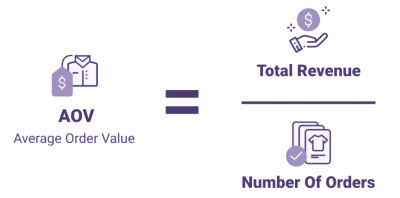
AOV is determined by sales per order and not per customer. Even if one customer comes back multiple times to make a purchase, each order would still be factored separately into AOV.
Customer Lifetime Value
Customer lifetime value (CLV) helps to measure long-term business success as well as predict future revenue. CLV determines how much profit you can expect from a client over the course of their ‘customer lifetime’.
Depending on your margins, you can figure out how much you need to invest by estimating the lifetime value of a customer for your business.
Marketing Metrics reports that the probability of selling your product or service to a new customer is at 5–20%. Your chance of selling the same to a regular customer is at 60–70%. That’s such a big difference, and it drives that point that retention is indeed more cost-effective than customer procurement. Retention is a lot cheaper than acquisition.
Time Between Orders
This refers to the time between successive orders. Depending on your type of product or service, this time period could be in terms of hours, days, weeks, or even months.
This is valuable to help you determine the timing of marketing emails. Your marketing emails remind customers to repurchase or offer promotions that will keep their repeat order rate high.
Repeat Rate Per Percentage to Second Order
Repeat rate is the most telling metric in proving how successful you are in retaining your customers.
This is the share of customers who patronize your business repeatedly (as opposed to cohorts who bounce after a single purchase).
Orders Per Customer
This is closely related to the previous metric. Simply put, the more repeat customers you have, the more orders they make each. High values in this metric likewise indicate a strong retention rate.
Final Thoughts
Of course, we must compare this to more popular analytics methods. Customer cohort analysis tends to be more long-term and can provide slower feedback. It’s not a one-off analysis. Instead, it allows you to see patterns and insights on trends regarding customer behavior.
It takes time to observe, gather, and analyze data. You will then translate these insights into actual marketing and advertising strategies.
However, customer cohort analysis can be very rewarding in the sense that it provides real-world, reliable insights regarding customer behavior. It shows you ways to save money (ads, loyalty programs) in areas where you don’t need to spend, and also where you need to increase your investment.
It provides you with a more thorough, big-picture overview of your user journey, and creates long-term value for your company over time.
Graphite Note gives your business automated customer cohort analysis models built with the help of predictive analytics. You can access a time-efficient, pro-tech solution to their data analysis needs. We’ve worked with real-life customers and standardized the ML models to be applicable for every customer. Request a demo today!