Sales forecasting techniques are a cornerstone of business strategic planning. Sales forecasting techniques equip you with insights to anticipate market trends. Sales forecasting helps you undertake informed decision-making. Traditional sales forecasting methods can be time-intensive, error-prone, and vulnerable to human biases. No-code predictive analytics and machine learning transforms sales forecasting. Machine learning makes accurate sales predictions a reality for all businesses.
Understanding sales forecasting and its importance in business
Sales forecasting involves estimating future sales. Sales forecasting is based on historical data, market trends, and other pertinent factors. Accurate sales forecasting enables your business to anticipate customer demand. Accurate sales forecasting also helps you optimize resource allocation, and maximize profitability.
Sales forecasting methods span across:
- Qualitative sales forecasting methods: Qualitative sales forecasting methods use expert opinions, market research, and subjective assessments. Qualitative sales forecasting methods are ideal when historical data is scarce. They are also useful when introducing new products or services.
- Quantitative sales forecasting methods: Quantitative sales forecasting uses numerical data and statistical models for predicting future sales. Time series analysis, moving averages, and regression analysis are examples.
- Hybrid sales forecasting methods: Hybrid sales forecasting methods merge qualitative and quantitative methods. These methods tap into the strengths of both to yield an accurate sales forecast. Weighted moving averages and collaborative forecasting are examples of hybrid sales forecasting methods.
Machine learning in sales forecasting
No-code predictive analytics platforms excel in offering user-friendly, intuitive interfaces. Machine learning in sales forecasting enables you to generate accurate forecasts, monitor market trends, and make data-driven decisions. Superior sales forecast accuracy is now accessible to all businesses. No-code predictive analytics yield a 73% increase in sales forecasting accuracy. As reported by Entrepreneur, businesses using predictive analytics could forecast future revenue with 82% accuracy. This is a stark contrast to the 55% of sales leaders expressing a lack of confidence in their sales forecasting accuracy. A sales prediction model is an essential tool for your business.

How machine learning enhances sales forecasting
Historically, many businesses have leaned on instinct and traditional methods to drive decision-making. Intuition-based choices can lead to negative outcomes. Machine learning in sales forecasting replaces guesswork. Instead, you’re working with reliable data-backed insights, substantially increasing both efficiency and accuracy. A machine learning model can empower your decision-making and enable enhanced business growth. Demand forecasts can be used to predict sales demands at particular times. This can enhance your sales team’s operations and bolster your sales team all round.
Advancements in data analytics and data science have revolutionized sales forecasting. Machine learning models and no-code predictive analytics empower businesses with precise forecasting tools. This enhances accuracy, efficiency, and usability. Machine learning algorithms examine historical sales data, market tendencies, and customer behavior patterns. This enables the ML model to deliver accurate future sales predictions. These intelligent tools recognize patterns, adapt to market changes, and fine-tune their predictions. ML models offer superior results to conventional forecasting methods. Machine learning models equip businesses with sophisticated sales forecasting models. Machine learning makes it easy to analyze extensive datasets with minimal human intervention.
Success stories of machine learning in sales forecasting
The commercialization of machine learning is visible in business operations. These include marketing, planning, and sales forecasting. For instance, a salesperson can leverage predictive analytics to make a sales prediction. They can accurately forecast a potential customer’s behavior. The sales team can then determine the most effective marketing campaign, email campaign, and more. Marketing campaigns can be more accurately targeted using machine learning. In the retail industry, machine learning algorithms predict customer purchasing habits. This helps businesses efficiently manage inventory, and increase revenue. You can make better business decisions with machine learning.
Consider the story of “Fancy Finds,” a thriving boutique owned by Sally. For years, Sally’s instincts dictated her business strategies, including inventory predictions. Her intuition misled her, when she overstocked floral print dresses in a season dominated by stripes.
That’s when she discovered no-code predictive analytics. Sally combined machine learning with historical sales data, local demographics, and current trends. The shift from instinct to data-driven insights improved Sally’s business. Sally now had more accurate sales predictions, cost savings, and improved decision-making capabilities. It also liberated her from the time-consuming process of manually monitoring her supply chain. This enabled her to devote more energy to other business operations. Sally’s ML model helped her grow her business.
Advantages of using machine learning in sales forecasting
No-code technology has transformed sales forecasting. No-code technology enables you to make data-driven decisions with confidence. By using machine learning algorithms to identify patterns and trends, businesses can anticipate market shifts. No-code predictive analytics is a game-changer for any business looking to gain a competitive edge. The advantages of using machine learning in sales forecasting include:
- Improved accuracy: Machine learning algorithms enable you to predict sales trends more accurately, reducing the risk of stocking unwanted items.
- Cost savings: Machine learning in sales forecasting enables you to reduce your excess inventory and avoid purchasing items that would not sell. This reduces your operational costs and improves your cash flow.
- Enhanced decision-making: With data-driven insights, you can make informed decisions and anticipate market shifts.
- Time efficiency: The no-code predictive analytics platform automates the forecasting process. This frees up your time to focus on other parts of your business.
Machine learning techniques in sales forecasting
Machine learning employs various techniques to analyze numerous data points before making predictions. These data points encompass demographic information, behavioral trends, and past transactions. By scrutinizing this data, machine learning can forecast future consumer transaction behaviors. Here’s how to implement machine learning in sales forecasting:
- Identify a model: Various models are used for forecasting, depending on the data type, business context, and the level of complexity required. The most appropriate model for forecasting will depend on the data being analyzed, the business context, and the level of complexity required. In many cases, a combination of different models may be used to achieve the most accurate and reliable forecasts. Your model evaluation process should be well considered. Some commonly used models include:
- Time series forecasting models: Ideal for forecasting time series data like stock prices or sales data.
- Regression models: Useful when forecasting is based on the relationship between multiple variables. Regression algorithms forecast sales volume by analyzing large volumes of past data. These algorithms are typically used with incomplete data to produce optimal results. For instance, a clothing business can use these algorithms to predict sales volumes. This helps with cash flow predictions or planning new advertising campaigns.
- Multivariate Models: These models are an expansion of regression algorithms. They use multiple variables for more accurate forecasting. For example, a business can use these algorithms to determine the profitability of specific products. This helps them decide which products to promote.
- Exponential smoothing models: Effective for forecasting time series data, placing more weight on recent data.
- ARIMA models: Best for data that showcases complex patterns like seasonality or trends.
- Neural network models: Neural network models use artificial intelligence for forecasting, identifying complex inter-variable relationships.
- Gather data: To generate accurate sales forecasts, it’s crucial to collect extensive, relevant data during a period devoid of significant events or financial changes. This data should then be categorized into sets that are:
- Complete: Include demographic information, past transaction history, and other relevant details.
- Incomplete: Missing certain relevant details. These datasets help determine the best future data collection methods.
- Develop and test your model: The model identified in step one will be used to generate forecasts. A new dataset that includes past transaction data, demographic information, and other relevant details should be created.
- Analyze your results: Finally, analyze the forecast results to evaluate the efficacy of the machine learning algorithms. The ultimate forecast is typically an aggregate of multiple contributions.
Now that you’ve completed your ML model evaluation, let’s look at an example of how no-code analytics and machine learning can enhance your sales forecasting, and demand forecasting.
In the following section, we’ll examine an example from the no-code AI platform Graphite Note. Using Graphite Note, we outline how machine learning enhances sales forecasting.
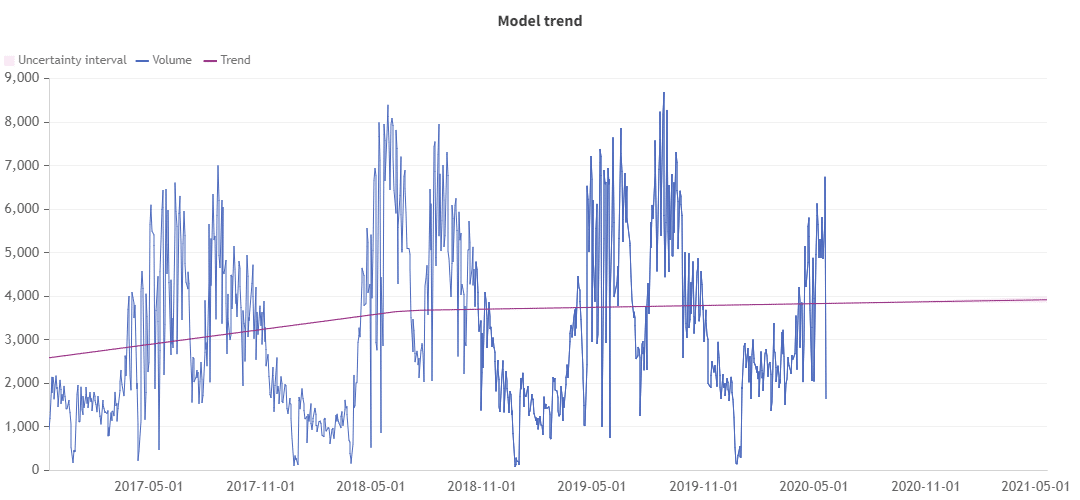
Global sales trend insights
The graph reveals a global trend identified from historical data. The change points, indicating where the trend alters from the previous period, are discernible. The trend minimum of 2589.16 was recorded on 2016-11-17, while the maximum of 3920.54 was on 2021-05-20.
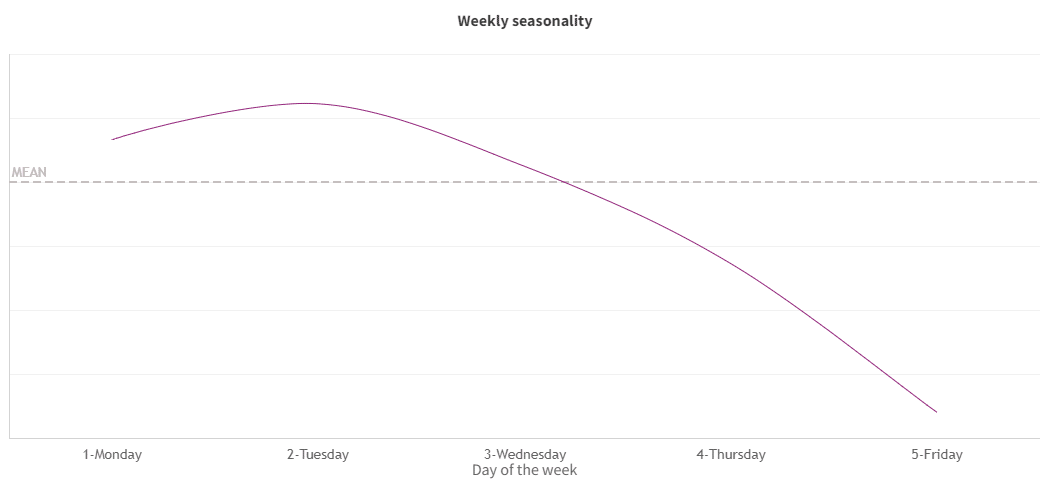
- Weekly seasonality in sales: A pattern that repeats every seven days is visible in the Weekly Seasonality graph. Remarkably, Tuesdays record the most significant positive effect while Fridays mark the highest negative effect. An ML model can predict a sales cycle and improve your supply chain management.
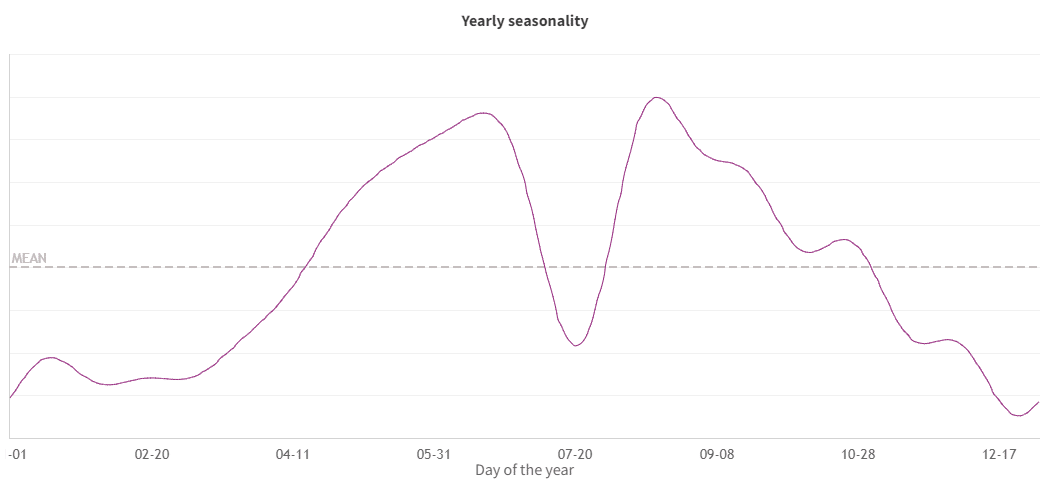
- Annual seasonality in sales: A pattern that recurs annually is displayed in the Yearly Seasonality graph. The most positive impact occurs in August, and December records the most negative impact. Using ML to analyze your sales cycle can improve your profit margin.
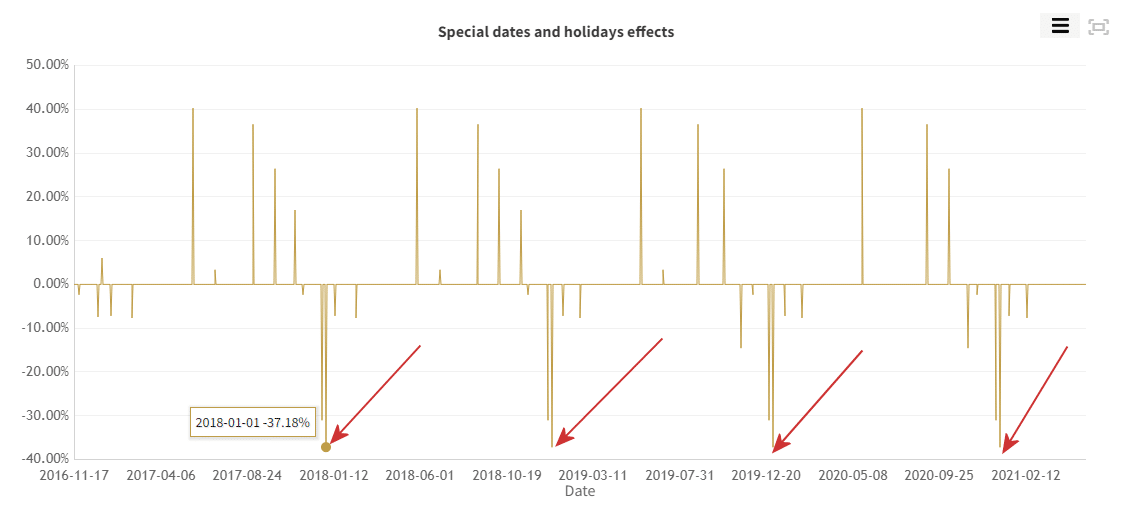
- Effects of holidays and special dates on sales: The graph illustrates the effect of special dates and holidays on historical and future sales data. These special dates can have either a positive or negative impact on sales. For instance, the first day of each year historically shows a significant negative downturn in sales. Using an ML model to assess the effect of holidays and special dates on your business can empower your decision-making.
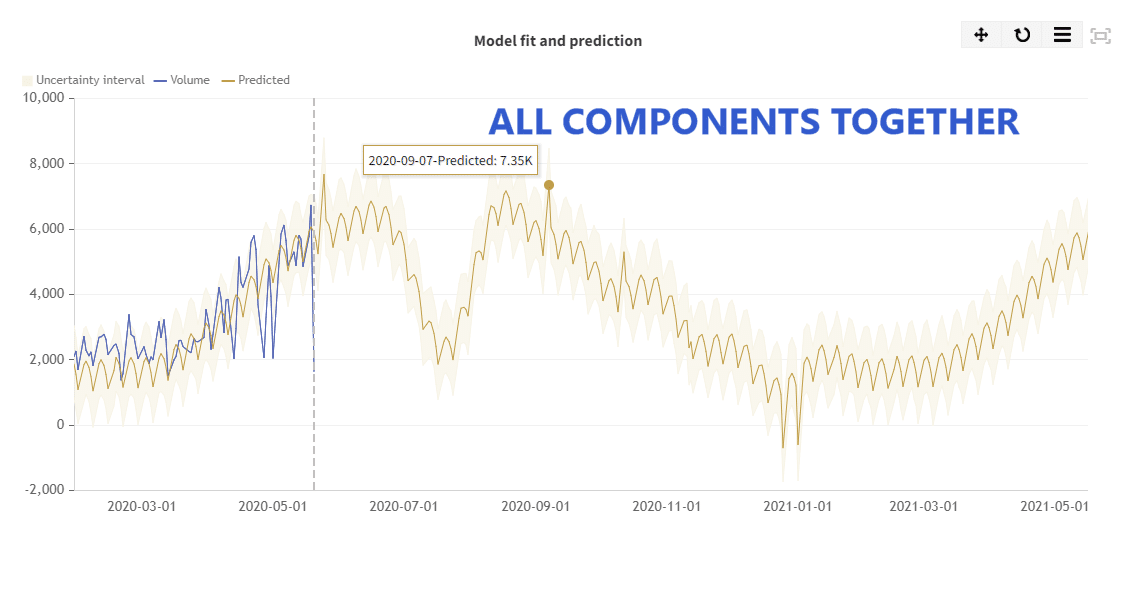
Incorporating weekly, monthly, and yearly seasonality, alongside holiday effects and global sales trends in your sales forecasting model can offer powerful insights.
This approach helps you predict future trends and stay ahead. Understanding when sales peak and dip allows you to make informed decisions. This holistic approach to sales forecasting can truly transform your business strategy. By visualizing these components in a chart, you can get a clear and insightful picture of your sales trends.
Conclusion
Sales forecasting is a complex yet crucial component of business intelligence. Sales forecasting guides companies in managing their cash flow and improving returns. You don’t need to be a data scientist to use machine learning. No-code machine learning solutions like Graphite Note give you ready-to-go pre-built models.
By leveraging the power of machine learning, you can confidently make data-driven decisions. You can identify market trends, and stay ahead of the curve in their sales forecasting. Businesses of all sizes can benefit from the technology, not just large corporations. Machine learning transforms sales forecasting into a precise science. This makes it easier, more accurate, and less time-consuming.