Imagine walking into a grocery store and noticing that every time someone buys peanut butter, they almost always grab jelly too. This simple observation is the essence of item basket analysis-a powerful tool that reveals hidden relationships in shopping behavior. But what does this really tell us about customers? How deep do these insights go, and how can businesses use them to make smarter decisions?
Item basket analysis isn’t just about spotting obvious pairs. It’s about uncovering the subtle, sometimes surprising patterns that shape how people shop. This article dives into the stories behind the data, the metrics that matter, and the practical uses-and limits-of this technique.
The Hidden Stories Inside a Shopping Basket
Every shopping basket is a snapshot of a customer’s needs, preferences, and even moods. When analyzed collectively, these baskets tell stories about habits, occasions, and even cultural trends. For example, a surge in sales of barbecue sauce alongside charcoal and disposable plates might indicate a spike in outdoor grilling season.
But beyond the obvious, item basket analysis can reveal less intuitive connections. Perhaps customers who buy gluten-free bread also tend to pick up certain organic snacks. These patterns hint at lifestyle choices or dietary restrictions that brands can use to tailor marketing messages or product placements.
Consider a retailer noticing that customers who purchase baby diapers often buy vitamin supplements. This might suggest a focus on family health, prompting the store to create bundled offers or targeted promotions. These “hidden stories” are what make basket analysis so valuable-it’s not just data; it’s insight into customer behavior.
Moreover, the seasonal shifts in consumer purchasing behavior can lead to fascinating revelations. For instance, during the winter months, an increase in sales of hot chocolate mix, marshmallows, and cozy blankets can paint a picture of families preparing for cold nights spent indoors. Retailers can then capitalize on this trend by curating special winter-themed displays or offering discounts on related items, enhancing the shopping experience while driving sales.
Additionally, the rise of online shopping has added another layer to basket analysis. Digital shopping carts allow for real-time tracking of consumer behavior, revealing how quickly trends can emerge and evolve. For example, if a popular health influencer promotes a new superfood, retailers can quickly analyze the influx of related products in shopping baskets, adjusting their inventory and marketing strategies accordingly. This agility not only helps businesses stay relevant but also fosters a deeper connection with consumers who feel their preferences are being recognized and catered to.
Pairs vs. Triplets: How Patterns Emerge in Real-World Data
Most people think of basket analysis as finding pairs of items frequently bought together. While pairs are the foundation, real-world shopping behavior is often more complex. Triplets—or even larger item combinations—can reveal richer patterns that pairs alone miss.
For example, a customer buying coffee and creamer might also be picking up a specific brand of biscotti. Identifying this triplet can help retailers create more effective cross-promotions or optimize store layouts. However, as the number of items in a combination grows, the complexity and data requirements increase exponentially.
That’s why many businesses start with pairs to capture the most common associations, then gradually explore triplets or quadruplets to uncover deeper insights. It’s a balancing act between actionable simplicity and comprehensive understanding.
Moreover, the significance of triplet analysis extends beyond mere sales optimization; it can also enhance customer experience. For instance, if a store recognizes that customers who buy a particular type of wine often purchase cheese and crackers, they can curate special offers or create bundled packages that cater to this preference. This not only boosts sales but also fosters a sense of personalization, making customers feel understood and valued.
Additionally, the application of triplet analysis can be seen in digital platforms, where algorithms suggest products based on user behavior. E-commerce giants utilize sophisticated machine learning techniques to analyze vast amounts of data, identifying not just what items are commonly bought together, but also the context in which these purchases occur. This allows them to tailor recommendations, ensuring that customers are presented with relevant options that enhance their shopping experience and increase the likelihood of additional purchases.
Support, Confidence, and Lift – The Only Three Numbers That Matter
To make sense of basket analysis, three key metrics come into play: support, confidence, and lift. These numbers help quantify how strong and meaningful the relationships between items are.
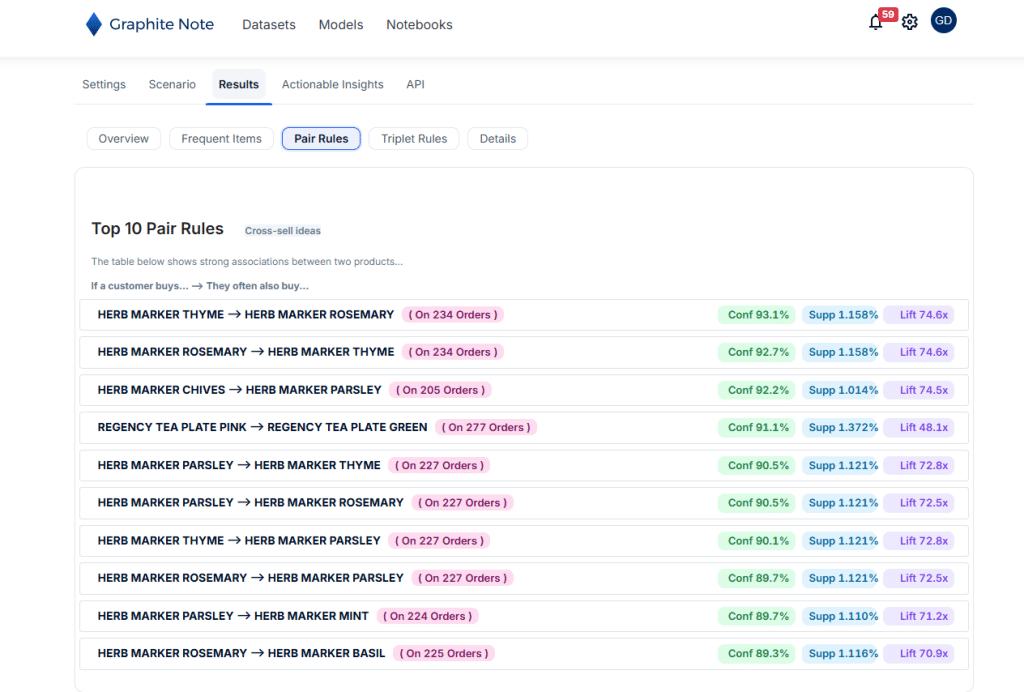
- Support measures how often an item or combination appears in the dataset. For example, if 10% of all transactions include both chips and salsa, that’s the support for that pair.
- Confidence tells you the likelihood of buying one item given the purchase of another. If 80% of customers who buy chips also buy salsa, the confidence is 80%.
- Lift compares the observed co-occurrence to what would be expected if the items were independent. A lift greater than 1 means the items are bought together more often than chance.
These metrics work together to separate meaningful patterns from noise. High support but low confidence might indicate a common but unrelated item, while high confidence with low support could mean a niche but strong association. Lift helps confirm whether the relationship is truly significant.
Understanding these metrics can significantly enhance marketing strategies and inventory management. For instance, by identifying high-lift combinations, retailers can create targeted promotions that encourage customers to purchase related items together, thereby increasing overall sales. Additionally, businesses can optimize their stock levels based on support metrics, ensuring that popular item combinations are always available, thus improving customer satisfaction and loyalty.
Moreover, the application of support, confidence, and lift extends beyond traditional retail environments. In e-commerce, for example, these metrics can inform recommendation systems that suggest products based on user behavior. By analyzing past purchases, algorithms can recommend complementary items, enhancing the shopping experience and driving additional revenue. This data-driven approach not only personalizes the customer journey but also fosters a deeper connection between the consumer and the brand.
What You Can Actually Do With These Insights
Understanding basket analysis is one thing; applying it effectively is another. The real value lies in turning data into action that improves customer experience and boosts business outcomes.
Here are some practical applications:
- Product Placement: Place frequently bought-together items near each other to increase convenience and impulse buys.
- Cross-Selling: Train sales staff or design online recommendations based on strong item associations.
- Promotional Bundles: Create combo deals that reflect natural buying patterns, increasing perceived value.
- Inventory Management: Anticipate demand spikes for related products, reducing stockouts and overstock.
- Personalized Marketing: Use basket insights to tailor email campaigns or app notifications with relevant product suggestions.
For example, a no-code predictive analytics platform can automate the identification of these patterns, making it easy for marketers and merchandisers to act quickly without needing a data science background. This democratization of data analysis empowers businesses of all sizes.
When Basket Analysis Fails
Despite its strengths, basket analysis isn’t a silver bullet. It has limitations and scenarios where it might mislead or underperform.

One common pitfall is over-reliance on correlation without understanding causation. Just because two items are bought together doesn’t mean one causes the other. External factors like promotions, seasonality, or store layout changes can skew results.
Another challenge is sparse data. For niche products or new items, there may not be enough transactions to generate reliable patterns. This can lead to false positives or missed opportunities.
Additionally, basket analysis typically focuses on what happens at the point of sale, missing broader context like online browsing behavior, customer demographics, or social influences. Integrating basket data with other sources can provide a more complete picture.
Finally, privacy concerns and data regulations require careful handling of customer data. Transparency and compliance are essential to maintain trust and avoid legal issues.
In short, basket analysis is a powerful tool, but it works best as part of a broader analytics strategy that considers multiple data points and business goals.
Unlock the Full Potential of Your Data with Graphite Note
Ready to take your item basket analysis to the next level? Graphite Note is here to empower your data analysis without the complexity of coding. Our intuitive platform enables you to create machine learning models in minutes, transforming your data into actionable insights with ease. Whether you’re predicting trends, building AI agents, or simply seeking to understand customer behavior better, Graphite Note has you covered. Try Graphite Note Now and harness the power of AI to drive smarter business decisions.