Manufacturing: Shift pattern optimization for scrap reduction
The Business Question This Model Answers
Does the time of day a job is scheduled cause higher scrap rates in manufacturing? And in what conditions does this impact become most costly?
This was the question the factory had been circling for months. Their dashboards showed higher scrap during night shifts. But they couldn’t tell if the shift itself was the issue, or if it was just paired with more complex jobs, less experienced operators, or worn equipment.
We tested it directly: if the product, machine, and operator stay the same, does the shift alone change the outcome?
It did. And the cost was massive.
Why Descriptive Analytics Weren’t Enough
Descriptive dashboards show patterns, but not causes.
They told the factory that scrap increased during night shifts. But they couldn’t explain if that was because of the shift, or because the shift had newer staff, or ran harder jobs, or suffered higher humidity.
That’s where most factories stop. They see a red bar on a graph, guess at the reasons, and take no action.
Causal analysis goes further. It isolates variables. It answers questions like: what happens if you hold every condition constant and only change the time of day?
Descriptive analytics reports the problem. Causal analysis tells you what creates it.
The Problem
The factory made high-precision metal components across three shifts per day. Defect rates had been rising. No one could explain why.
Machines passed inspection. Materials met specs. Staffing levels were steady.
But scrap kept increasing.
Supervisors pointed to the night shift. But opinions weren’t enough. Leadership needed evidence before making changes.
The Data
We analyzed 18 months of production data. Every record showed what was built, by whom, on what machine, at what time, and under what environmental conditions.
We tested whether shift timing directly caused higher scrap, adjusting for all other business conditions.
Context variables we accounted for:
- Operator experience
- Product type
- Machine utilization
- Maintenance history
- Order complexity
- Humidity during production
This allowed us to isolate the effect of shift timing without confusing it with other operational factors.
Dataset Columns Used
These were the real columns used in the model:
shift_id– morning, afternoon, or nightscrap_rate– percentage of defective units per runoperator_experience_level– novice, intermediate, or seniorproduct_type– standard or precisionmachine_utilization– percent of daily capacity usedrecent_maintenance_flag– yes or noorder_complexity_score– scale from 1 to 5humidity_level– relative humidity inside the factory during the run
This structure let us test not just what happened, but why it happened.
What We Found
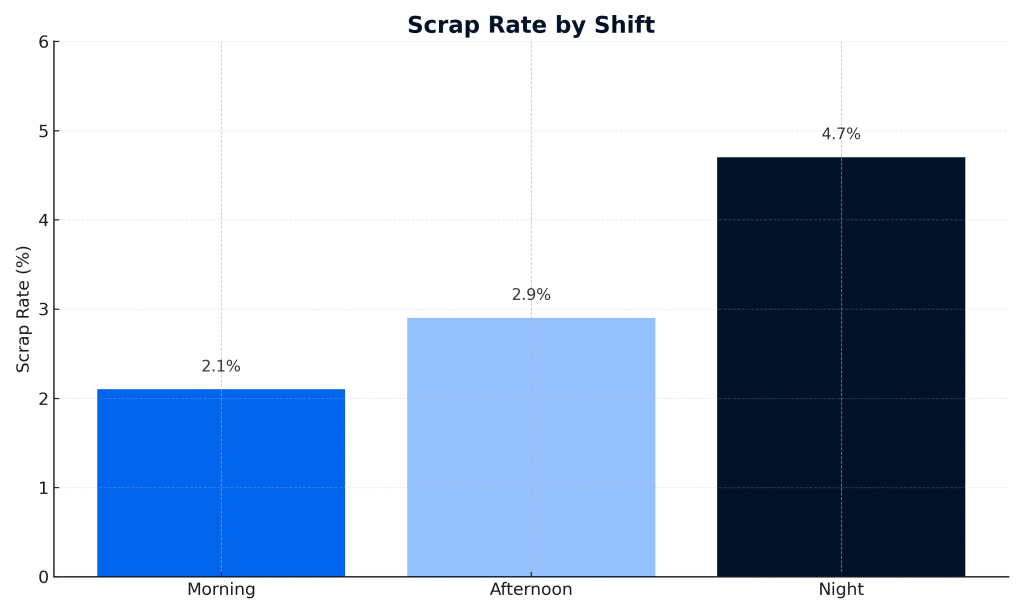
Scrap Rate by Shift

- Morning: 2.1%
- Afternoon: 2.9%
- Night: 4.7%
Even after adjusting for other conditions, the night shift had significantly higher defect rates.
But the differences became clearer when we broke the data down by specific operational contexts.
When Shift Timing Becomes a Problem
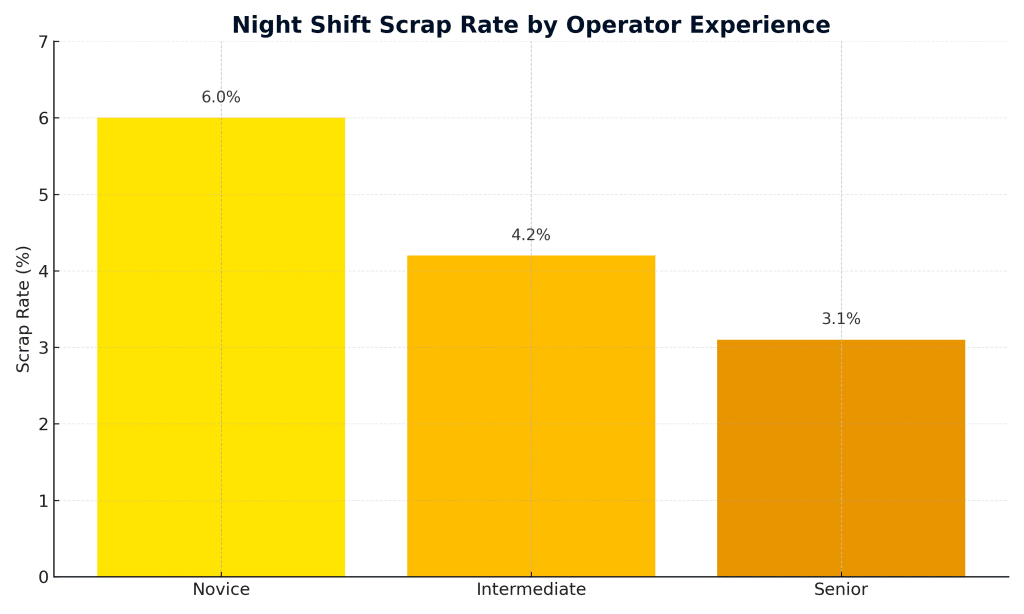
Operator Experience

- Senior: Night scrap remained under 3.1%
- Intermediate: Scrap rose to 4.2%
- Novice: Scrap often exceeded 6.0% on night shift
Insight: Inexperience combined with fatigue drove waste.
Product Type
- Standard: Little variation across shifts
- Precision: Night scrap jumped by 2.8%
Insight: Complex parts suffered most from reduced alertness and delayed corrections.
Machine Utilization
- Below 70%: Night and day showed similar results
- Above 90%: Night scrap rose sharply past 5%
Insight: The system couldn’t absorb pressure when operating at full capacity overnight.
Maintenance Status
- Recently serviced: Stable across shifts
- Overdue: Night shift defects increased by 2% or more
Insight: Failures that could be corrected during the day went unaddressed at night.
Humidity
- Below 40%: No meaningful effect
- Above 60%: Night scrap increased by up to 1.5%
Insight: High humidity combined with lower supervision created quality risk.
The Business Prescription
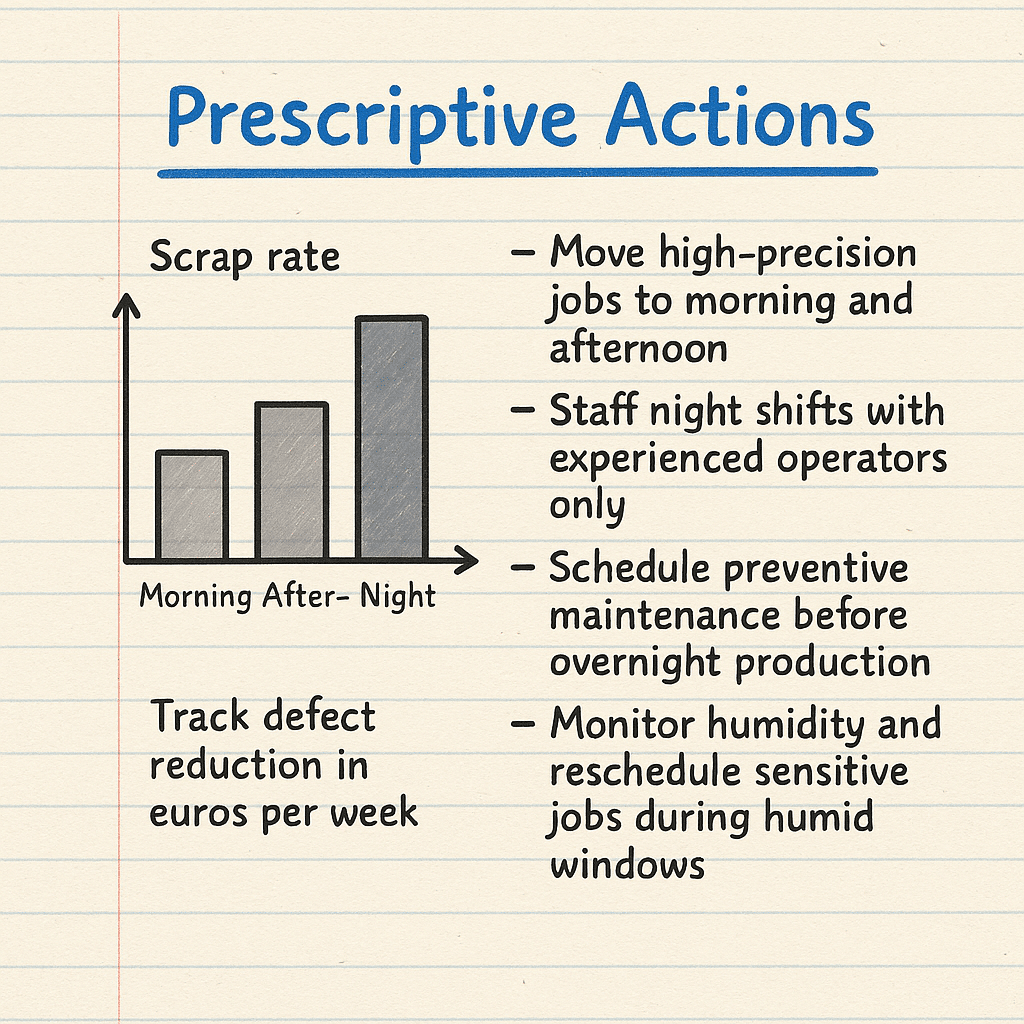
The factory didn’t need a full process redesign. The data pointed to five practical actions:
- Move high-precision jobs to morning and afternoon
- Staff night shifts with experienced operators only
- Schedule preventive maintenance before overnight production
- Monitor humidity and reschedule sensitive jobs during humid windows
- Track defect reduction in euros per week and report it visibly
These decisions were low-cost, high-impact. No extra labor. No tech purchases. Just smarter timing.

Why It Mattered
The company reduced scrap by 1.6 percentage points.
That translated into more than €3.4 million in annual savings.
- No new equipment
- No added staff
- No production delays
They also cut customer returns and improved delivery accuracy.
All from rethinking shift patterns and scheduling.
Why It Was Believable
The recommendation was trusted because it was testable.
- The pattern held in holdout data
- Every operational condition was controlled
- Supervisors said the insights matched their daily experience
Leadership finally had hard proof. They moved quickly and saw results in under six weeks.
A Blind Spot in Manufacturing
Many plants treat scheduling as a static constraint. But timing is just another lever, like machine speed or quality control.
Ignoring shift effects leads to hidden waste. Measuring them opens room for smarter planning.
The data was always there. It just needed the right question.
Conclusion
Scrap wasn’t a mystery. It was a consequence.
And once the factory saw the conditions that made it worse, they changed how they worked. Not with new tools or expensive consulting. With insight.
📅 Want to see how your shift timing affects profit?
Book a demo with Graphite Note:
https://graphite-note.com/book-demo


