
As a business owner, it’s imperative to know what best serves your customers. Understanding your customers’ preferences, purchase histories, and experiences with your business is key. The ABC analysis can bring you closer to understanding some key factors that influence your customers’ relationship with your business. The ABC analysis can also help you pinpoint your best and worst performing products. You can then optimize your products and services to better suit your customer preferences.
The Inventory ABC analysis is also known as the Pareto analysis. This is also known as the 80/202 rule. The ABC analysis is a method used to classify and prioritize tasks, items, and events based on their importance. The ABC analysis is a cause-and-effect framework used to organize and manage information.
The ABC analysis can be used to:
- Determine priorities for improvement in a process,
- Identify the causes of a problem.
The ABC analysis is used in business management to organize and prioritize tasks, analyze costs, and plan production. When it comes to inventory management, the Pareto principle, also known as the 80/20 rule, forms the basis of the ABC analysis, highlighting that 20% of items (A) typically account for 80% of the total value.
Managing inventory is the most significant expense in running a business. US retailers keep approximately $1.35 in inventory for every Dollar they make. When you have clear insight into your inventory costs, you can control them more easily. The amount that business spends on holding inventory over time is usually 15% to 30% of the value of a company’s inventory. In the Inventory ABC analysis, items are classified into three categories to create a top-down approach. In this article, we’ll walk you through everything you need to know about using the Inventory ABC analysis for your business.
What Is Inventory ABC Analysis?
The ABC Inventory Analysis can help you identify your top and worst performing products based on their overall inventory cost. ABC analysis classifies inventory items into three categories (A, B, and C) based on their annual consumption value. Inventory categorization using ABC analysis enables you to optimize inventory management strategies for each product group. ABC classification prioritizes inventory control efforts by focusing on the high-value A items that contribute most to the overall inventory cost. This inventory management technique helps businesses identify grade A items, which are typically high-value products with significant profit margins. Inventory management software can be used to automate ABC analysis calculations and facilitate data-driven inventory control decisions. Inventory classification based on the ABC analysis enables you to optimize inventory levels and minimize carrying costs for each category. By implementing ABC analysis, you can define clear inventory policies and prioritize resources for managing your most valuable items.
Inventory control efforts become more efficient with ABC analysis, as your business resources are focused on managing the most popular inventory items. An inventory management system that integrates ABC analysis can streamline your inventory control processes and improve your overall efficiency. By optimizing inventory control efforts based on the ABC classification, you can minimize unnecessary holding costs associated with low-value items. Each inventory item within a category (A, B, or C) should be analyzed based on its sales volume to identify top and worst performing products.
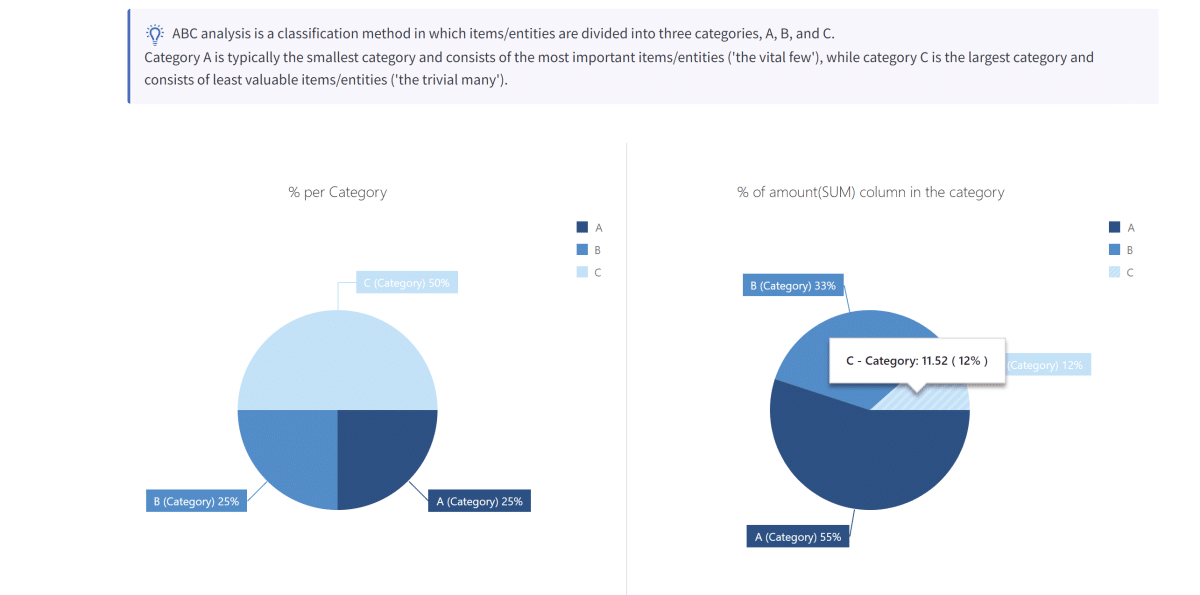
Inventory ABC analysis is a classification method in which products are divided into three categories, A, B, and C. The overall inventory cost is significantly affected by the management strategies applied to each category (A, B, and C) identified in the ABC analysis. Category A is typically the smallest category and consists of the most important items/entities (‘the vital few’), while category C is the largest category and consists of least valuable items/entities (‘the trivial many’). The ABC class of an inventory item directly relates to its total inventory value, with A items having the highest value and C items the lowest.
- A category. The vital few: Category A contains your best performing products. These are the money makers of your business. Typically, only a tiny percent of the total accounts for 80% of your revenue. This is your most valuable inventory. Category A products and services should be protected and prioritized as much as possible. Grade A products are the most critical items in the inventory, requiring close monitoring and potentially higher safety stock levels to prevent stockouts.
- B category. The middle value: Category B products are your middle-value products. Value items within the B category require a balance between inventory control and readily available stock to maintain customer satisfaction. They should be treated as such. Category B products typically account for the next 10%-15% of your revenue.
- C category. The trivial many: Category C products are your worst performing products. Usually, Category C products represent products that account for the remaining 5%-10% of your revenue. C items, representing the lowest value category, often include numerous low-cost supply chain items with minimal effect on the overall inventory cost. C category products bring very little value to your business. You should deprioritize them as much as possible. While category C products have the lowest individual value, their total inventory value can be significant, and efficient management is still crucial.
These three categories are used to determine the “Golden Ratio” (the 1:1.618 sequence of priorities) to determine the importance of your products. This is a method that has been around for centuries, with its origins in ancient Greece. It was only in 1940, however, that this method was formally recognized.
The ABC analysis has a very simple logic. The more resources that are allocated to an item, the sooner that item can be accomplished. This enables you to identify and focus on the critical tasks needed to accomplish a goal. Similarly, this enables you to identify and focus on the most important products that serve your business, and your customers, well. Inventory levels and stock levels should be carefully monitored and adjusted based on the ABC classification to avoid stockouts for critical A items.
This analysis method helps to improve performance and efficiency. The ABC analysis identifies bottlenecks and prioritizing tasks. The key is keeping track of all possible causes of a problem or improving performance.
What Is General ABC Analysis Used For?
ABC analysis can be used by anybody who needs to determine the priorities of a set of tasks. The method is primarily used in businesses, such as manufacturing and service operations, and is even popular in the nonprofit sector. The ABC analysis is also used in the financial sector to prioritize withdrawals from investment portfolios.
The ABC analysis can be used by people who want to do their job more efficiently. It can also be used by managers who want to allocate resources properly. The ABC analysis is also popular among people who are trying to improve their own efficiency or manage tasks effectively.A Pareto chart can be used to show the relationship between various activities that contribute to the results of a company.
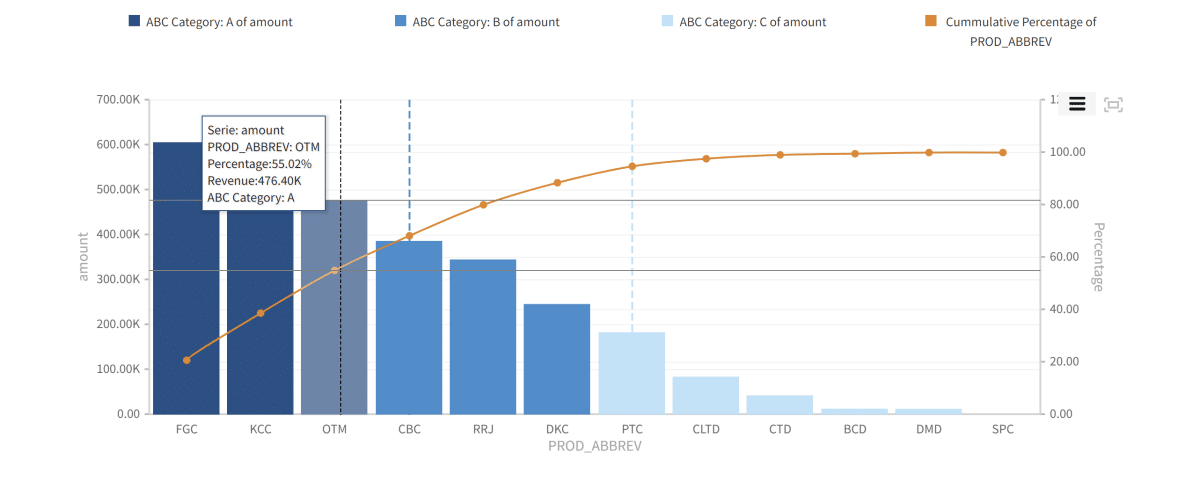
What Is a Pareto Chart?
The Pareto chart is a graph that shows the percentage of changes. A Pareto chart helps you track defects and how these defects affect a goal.
These charts may seem confusing at first look, as they combine the main aspects of a bar and line graph. The bars are used to indicate a problem or defect. The height of the bar will then show a corresponding measurement unit. In most cases, this refers to the cost or the problem’s frequency.
Traditionally, the bars should descend and indicate which aspects need more attention. This enables you to identify which problems require the most attention quickly.
The line indicates cumulative data from the bar graph. Measured in percentage, this will help you gauge the long-term effects of each defect or problem.
How Do You Conduct ABC Analysis?
Software like Graphite Note can help streamline your Inventory ABC analysis process. It’s also important to know how to do it on your own, especially if you want to stay on top of your business.
The first step is evaluating the process and prioritizing the steps needed to improve it. You can then use a Pareto chart to identify which portion of your problems can impact your results the most.
Here’s how you can do it:
Step 1: Define Your Goals
The first step is to define your goals. Determine what you want to improve upon or what your end goal is. Allow the problem to sit on your mind for a little while. This will help you to define it properly. Then, make a list of your problems or areas that need improvement. Organize them into different categories. This will give you an idea as to which areas might need some extra attention.
Step 2: Evaluate Your Process
The second step is to evaluate your process. Separate your problems into different categories and begin analyzing the problem. For example, you might have different categories for problems that occur frequently, the most frequently occurring problems, or those that cause the most damage to your business.
Step 3: Make a List of Possible Solutions
Step three is to make a list of possible solutions for each problem. Look at your list of problems. Then, try to come up with solutions that could help you avoid these problems in the future. This is where your expertise will come into play.
Step 4: Prioritize Problems
Next, prioritize your list in an ABC analysis format. Start with your most important problem. If it’s a problem that causes serious damage to your business, put it in the A category. Next, decide if problems in the B category are causing considerable damage to your business or if they’re costing you a significant amount of money. Finally, move on to the C problems. These are problems that cost you some time and money, but not as much as those in the B category. Complete your analysis by determining if anything can be put in the “No Action” category.
Step 5: Select a Solution
After you’ve completed your analysis, you should have a few solutions that could improve your business or solve your problems. Go over them again and find the best solution for each problem. You can also review your list of possible solutions and evaluate them individually. When you’ve chosen a plan of action, it’s time to move forward and implement the change. This will help you implement your strategy and improve your business.
Successful companies need to be flexible enough to adapt to change. This is why they must prioritize what needs more attention and spend their resources accordingly.
Why You Should Look Into ABC Analysis
ABC analysis is an exceptionally effective way of identifying problem areas. ABC analysis helps you identify precisely what needs to be addressed immediately and what can be addressed later. This will help you hold individual contributors and teams responsible for the problems that affect your business.
Moreover, when you use a Pareto chart to identify which problem causes the most damage to your business, it empowers you to decide where to spend your resources so that you can avoid those problems in the future.

Conclusion
An ABC analysis differs from an A/B test, but they’re both very useful techniques for determining where problems occur most often or where you can see the most improvement.Whether working on a new project or trying to improve your business, or working on your inventory ABC analysis, you need to use these handy charts to identify where your problems lie. Then, by prioritizing the problem areas, you can avoid the mistakes that will cost your business the most money. If you’d like to automate this process even further, look into software like Graphite Note to make your job easier and more productive.