Predicting Customer Churn
It’s important for your business to understand how to predict customer churn and retain your customers. Billions of data points are available for you to analyze, that can boost your operations. You can gather, store, process, and analyze customer data to enhance your operations and profit margins. A customer churn prediction model can benefit your business in a variety of ways. Predicting customer churn is important for subscription-based businesses. Subscription-based businesses need to focus on customer retention. Effectively managing your customer churn rate helps you build a better business.
Customer acquisition and customer retention
The cost of acquiring a new customer may be higher than retaining a customer by as much as 700%. Increasing your customer retention rate by a mere 5% could increase profits by 25% to 95%. In this article, we show you how to conduct customer churn analysis and customer churn prediction. We analyze this using Graphite Note, without writing a single line of code.
What is customer churn?
Customer churn refers to the rate at which your customers cease to participate in your sales funnel or operational funnel. Customer churn can also relate to their exit points within a system or process, which may be involuntary customer churn. Customer churn rates are also known as customer turnover or customer attrition. Customer churn occurs when your customer stops using or engaging with your business’ product or service. There are other types of churn your business should understand;. These include: customer journey, revenue churn, product churn rates, and other types of customer churn analysis.
Customer churn model
Machine learning can find patterns in data and learn from it, without explicit programming. In customer churn prediction models, the model will observe behavior and characteristics.
This helps you identify high customer churn points. You can identify churned customers. You can realign your marketing strategies to prevent a high customer churn rate. You can analyze customer behavior to assess your customer attrition rate. You can look at customer feedback to give you better insight into your customer interactions. You can assess your customer base, see what makes loyal customers, and improve your customer service. You can pinpoint your customer attrition rate and find out what builds customer loyalty. You can find out what causes involuntary churn. Your churn data will tell you more about poor customer experience. Your churn data can also help you enhance your customer relationships. Your churn reduction strategies can help you keep valuable customers. You can assess your current customers to see which ones are at risk customers. You can look at your customer lifetime value and customer acquisition costs.

A customer churn model helps you enhance your customer satisfaction levels. You can also enhance your customer support services by using this data. You can analyze your voluntary churn, strategize to prevent a high churn rate, and assess your average churn rate. An effective customer churn model helps you assess your customer needs and build better customer retention strategies. You can pinpoint and attend to poor customer service points. You can work to create a lower churn rate and ensure your customer needs are met. Using this data, you can build tailored customer retention strategies. You can also understand your customer acquisition cost and assess new subscribers. You can find where your marketing efforts work best, and where your marketing efforts don’t work well.
Machine learning and customer churn model
In the training phase, the machine learning algorithm will find customer behavior patterns. This will help you assess customers who have already left your business.
Once trained, the machine learning algorithm checks the behavior of future customers. If the algorithm spots a familiar pattern, it can point out at risk customers for churn.You can then take action and engage with these customers. You can understand their pain points, and prevent customer churn before it happens.
Dataset for Predicting Customer Churn
How do we start working with churn rate prediction? What data do you need for predicting customer churn?
For this tutorial, we use a Telecom Customer Churn dataset from Kaggle. This is quite popular for churn modeling.
Each row represents a customer, and each column contains the customer’s attributes.
The dataset contains information about:
- Customers who left – the column is called “Churn”, and this will be the target column in our Model (something we want to predict).
- Services that each customer has signed up for – phone, multiple lines, internet, online security, online backup, device protection, tech support, and streaming TV and movies.
- Customer account information – how long they’ve been a customer, contract, payment method, paperless billing, monthly charges, and total charges.
- Demographic info about customers – gender, age, and if they have partners and dependents.
Import customer churn dataset
Let’s import and parse a CSV file that we previously downloaded from Kaggle.
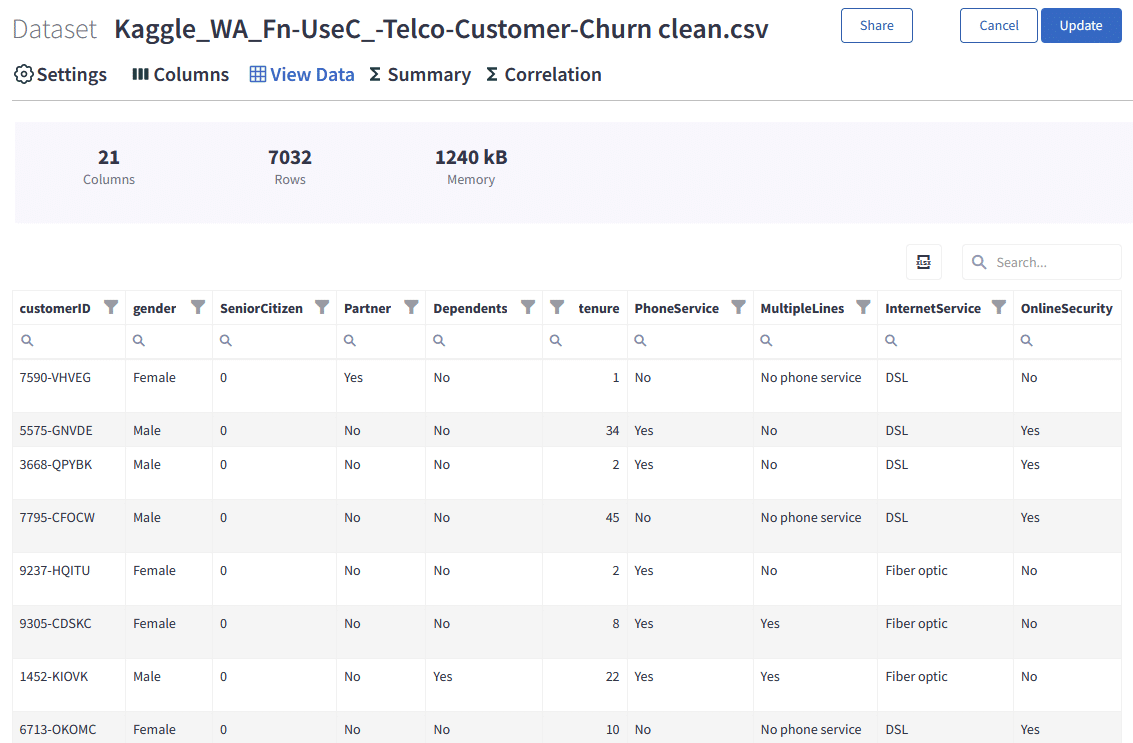
We can browse through our dataset rows, filter, or search on the View Data tab.
We have 21 columns and 7032 rows.
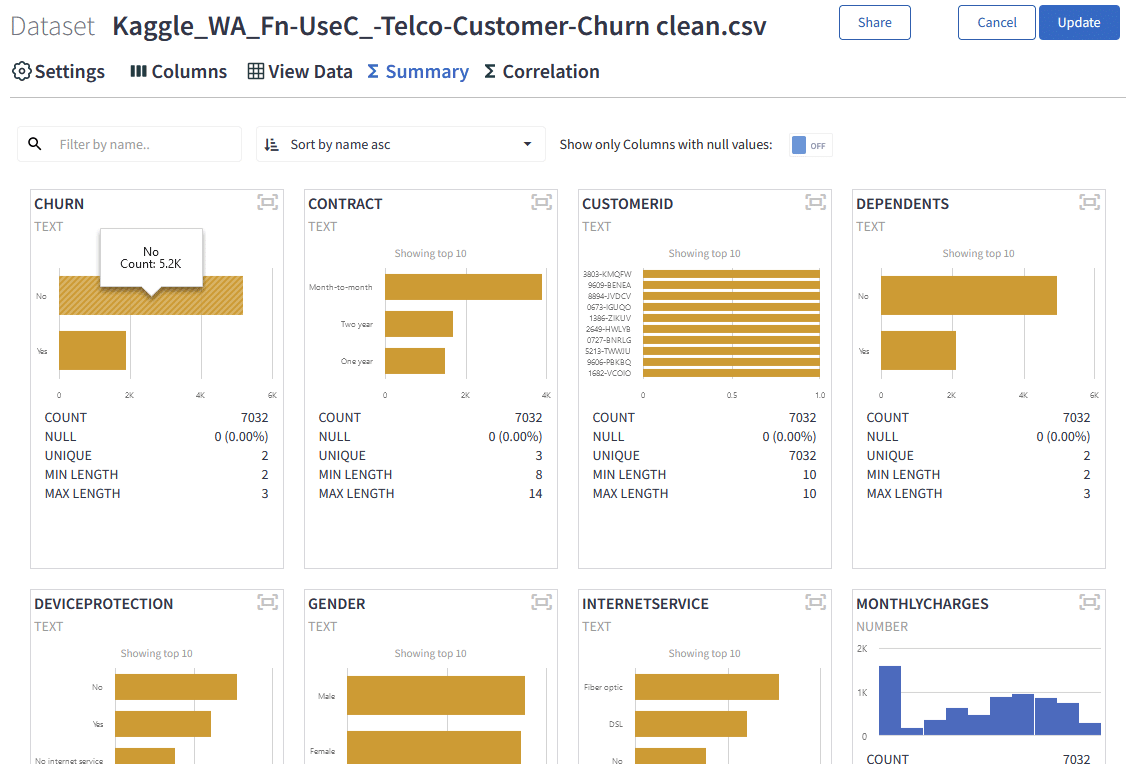
Every uploaded dataset in Graphite has a practical Summary tab. It enables, at a glance, to check distributions of numeric columns, the number of null values, and different statistical measures.
We can quickly check that our target column, “Churn”, explaining if a customer left or not, is not very imbalanced. That means we have enough “yes” and “no” signals to train the model.
It is interesting to see the distribution of some of the columns, like “monthly charges”. Most of our customers have monthly charges up to $28. Another customer group is centred around $80 / month.
Dataset classification model
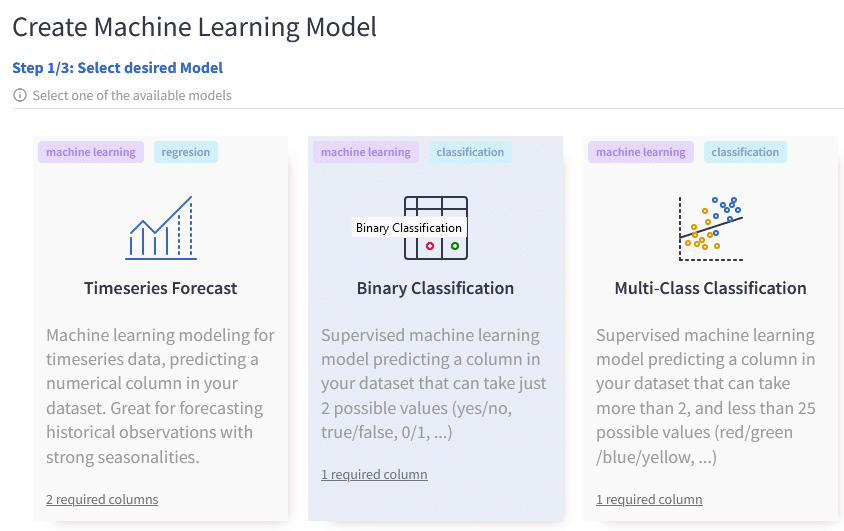
Predicting Customer Churn is a great use case of binary machine learning classification.
The reason is because our target variable, “Churn” can have only two states –
- NO – not churner
- YES – churner.
We say this dataset is labeled correctly (with target variable Churn), and we are ready to train a model.
Run the no-code machine learning model
Now we have our dataset uploaded. All is set to create a no-code machine learning model in Graphite. We chose the Binary Classification model.
In Graphite Note, to build a binary classification model, you need
- a binary target column (what are we predicting, with only two distinct states? For us it is a column “Churn”)
- a set of features (other columns from the dataset that have an impact on the target column)

In just a few mouse clicks, we will define a model Scenario in Graphite.
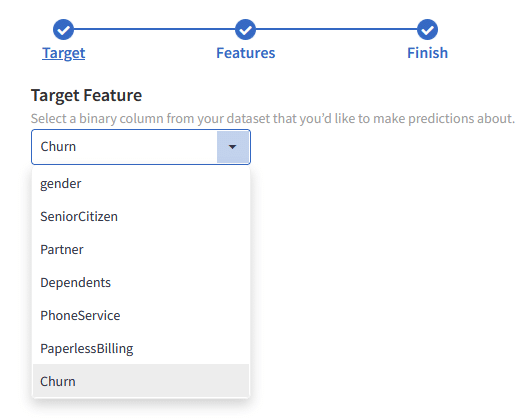
We select our Target column from our dataset:
We selected all other columns as features.
Customer churn analysis
We will leave all other options on default and run this scenario.
Graphite will take care of several preprocessing steps to achieve the best results, so you don’t have to think about them. If you are curious about technical stuff, all these preprocessing steps will occur automatically:
- null values handling
- missing values
- One Hot Encoding
- fix imbalance
- normalization
- constants
- cardinality
Graphite will take a sample of 80% (5625 rows) of our data and train several machine learning models.
Then, it will test those models on the remaining 20% (1407 rows) and calculate relevant model scores. Based on scores, it will select the best performing model for the dataset.
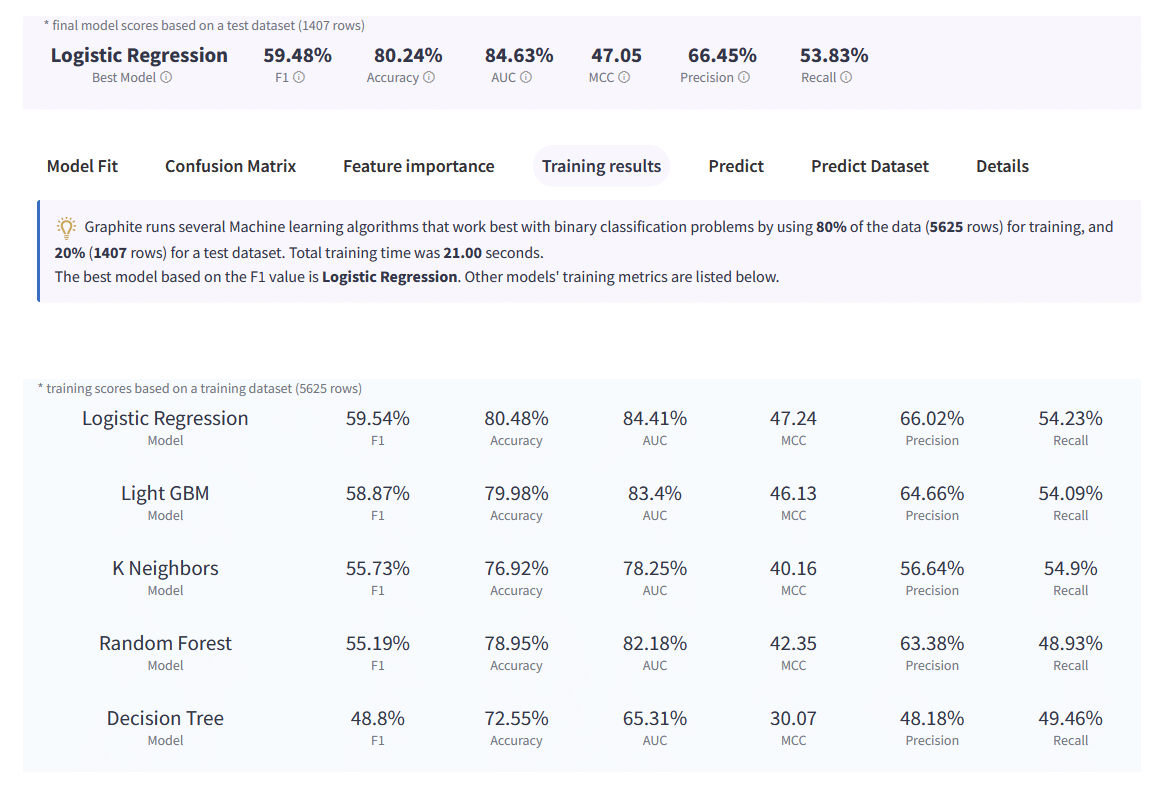
The best model fit, results, and predictions are available on the Results tab, after about 20 seconds training.In our case the best Model based on the F1 value score is Logistic Regression. Other models’ training metrics are listed below.
Confusion matrix
Confusion Matrix makes it easy to see whether the Model is confusing two classes (YES and NO in our case). For each class, it summarizes the number of correct and incorrect predictions. The Model predicted column ‘Churn’ for a test dataset of 1407 rows and compared the predicted outcomes to the historical outcomes.
Correct Predictions
1129 in total out of 1407 test rows. This is defining Model Accuracy = 80.24%
True Positives (TP) = 204: a row was Yes and the model predicted a Yes class for it.
True Negatives (TN) = 925: a row was No and the model predicted a No class for it.
Errors
278 in total out of 1407 test rows, 19.76%
False Positives (FP) = 103: a row was No and the model predicted a Yes class for it.
False Negatives (FN) = 175: a row was Yes and the model predicted a No class for it.
Other Model Scores
Please note that we describe predicted values as Positive and Negative and actual values as True and False.
Accuracy, (TP + TN) / TOTAL.
From all the classes (positive and negative), 80.24% of them we have predicted correctly.
Accuracy should be as high as possible.
Precision, TP / (TP + FP).
From all the classes we have predicted as positive, 66.45% are actually positive.
Precision should be as high as possible.
Recall, TP / (TP + FN).
From all the positive classes, 53.83% we predicted correctly.
Recall should be as high as possible.
F1 score, 2 * (Precision * Recall)/(Precision + Recall).F1-score is 59.48%. It helps to measure Recall and Precision simultaneously.
Feature importance
Feature importance refers to how much this Model relies upon each column (feature) to make accurate predictions. The more a model relies on a column (feature) to make predictions, the more important it is for the Model overall. Graphite uses a permutation feature importance for this calculation.
The most important feature is column
- “tenure” (Number of months the customer has stayed with the company), then
- “Total Charges”,
- “Contract”,
- “Internet Service” and so on.
For example, “gender” and the fact that customer is “Senior citizen” or not don’t have any influence on churn.
In Graphite, it is straightforward to check any feature concerning our target column (“Churn”).
Legend:

- green – customers that churned
- blue – customers that are still with us
Notice that most churn can be seen in the tenure 0-5 months, and then again for tenure 50-55 months. Already some valuable info for your customer success team.
Next insight is that most churn can be seen in the contracts that are “Month-to-Month”:
Regarding Internet Service – likelihood of customers to churn is bigger if they use “Fiber Optic”.


Predicting churn for new customers
It is important to say that Graphite Note automatically deploys trained Models.
That means it is easy to predict new, unseen data on customer churn. We can get answers to questions like “Who will churn next”? “What is the probability of that outcome”?
Suppose your team gives you information about new customers after you train the Churn Model with Graphite.
You can quickly check whether customers will churn – and the probability of churn.
A powerful tool to increase your retention.
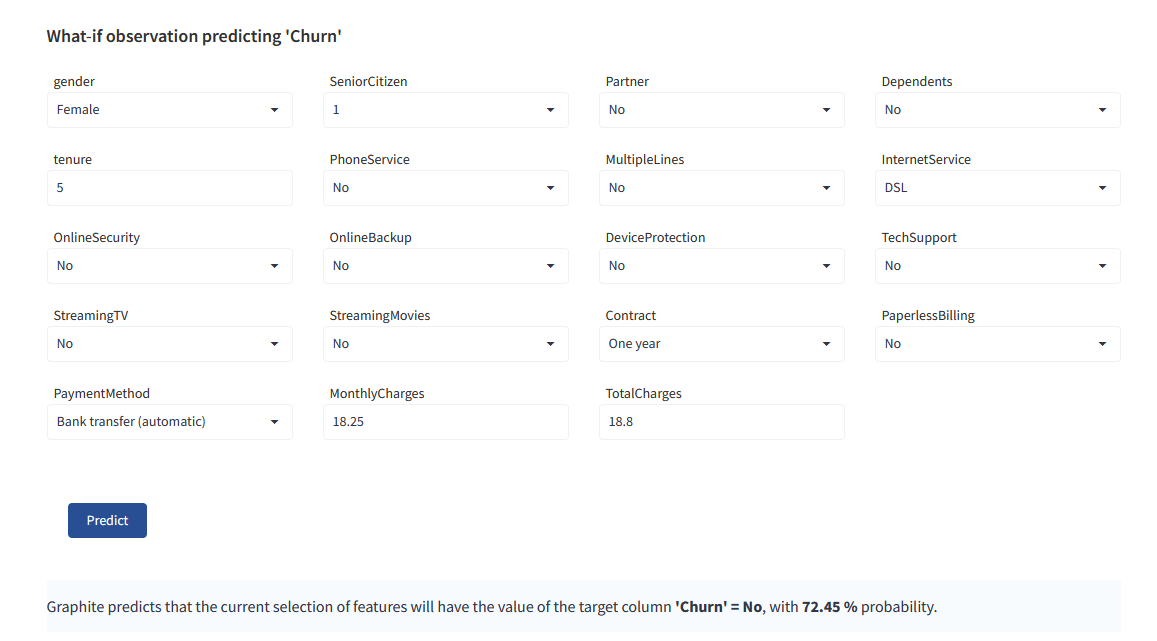
Let’s check the churn prediction for one of the new customers:
The Model claims this one will not churn, with 72% probability. He is not a target for the customer success team.
He is a better candidate for upselling or participating in a case study than a customer who is currently a churn risk.
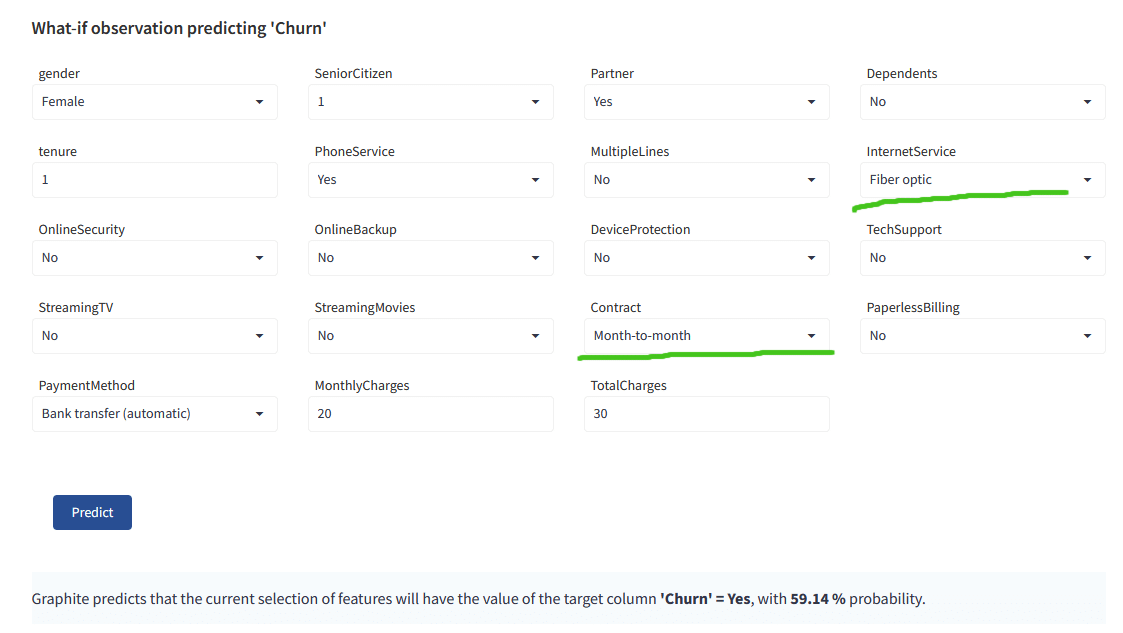
For another new customer, the model is predicting that she WILL churn:
The main drivers, if you recall, are tenure, Contract, Internet Service – this customer has a Month-to-Month contract, and Fiber Optics, which signals she is likely to churn.
Conclusion
Churn is a natural health indicator for subscription-based companies. Identifying customers who aren’t happy with provided solutions allows businesses to learn about operation problems, product or pricing plan weak points, and customer preferences to reduce reasons for churn proactively.
Also, it’s essential to define data sources to have a complete picture of customer interaction history. The more qualitative the dataset, the more precise forecasts will be.